Arcadia Group: The Value Wasn’t Lost. It Was Mispriced. research poster
All Research
53Mispriced Assets™ 20 min readSeptember 2026
Coverage · United Kingdom · USA & International · Institutional CoverageSector · Apparel & Fashion Retail · Multi-Brand Portfolio, Property & Digital CommerceFormat · Six-page audit

Arcadia GroupA Case Study In Strategic Value Overlooked, Not Destroyed.

Arcadia Group was one of the UK’s most influential retail empires — Topshop, Topman, Burton, Dorothy Perkins, Evans, Wallis, Miss Selfridge and Outfit. Founded on a 1902 group history, it peaked at 2,500+ stores globally, £2.6BN+ of annual revenue and 20,000+ employees. Legacy operating models, high rent leverage and slow digital transformation led to its collapse — not a lack of underlying value. This audit identifies £4.4BN+ of overlooked value across brand, property, customer, IP and digital assets.

Founded (Group History)

1902

Brands At Peak

100+

Stores Globally

2,500+

Peak Annual Revenue

£2.6BN+

Employees At Peak

20,000+

The Mispricing Gap

£4.4BN+

Enterprise Value Potential

£4.4BN+

Global Apparel Market

$1.81TN+

The Thesis

Arcadia is read as the definitive collapse of the British high street. The number that matters is different: at collapse, the group’s separable assets carried an estimated £1.58BN of realisable value against £4.75BN+ of intrinsic value — a £4.4BN+ mispricing gap across brand equity, store property, the customer database, IP and digital assets. Topshop alone had cultural authority that no fast-fashion entrant has replicated since. What killed Arcadia was structural: a 2,500-store estate on legacy leases carrying high rent leverage into a channel shift the group never funded, plus a portfolio of 100+ brands with overlapping ranges and no unified customer view. Those are operating and capital-structure failures against a $1.81TN global apparel market still growing 4–5% a year. The brands. The people. The position. The potential.

Exhibit · Report Cover

53 · Mispriced Assets™

Arcadia Group: The Value Wasn’t Lost. It Was Mispriced. report cover
Arcadia Group: The Value Wasn’t Lost. It Was Mispriced.September 2026 · United Kingdom · USA & International · Institutional Coverage
01

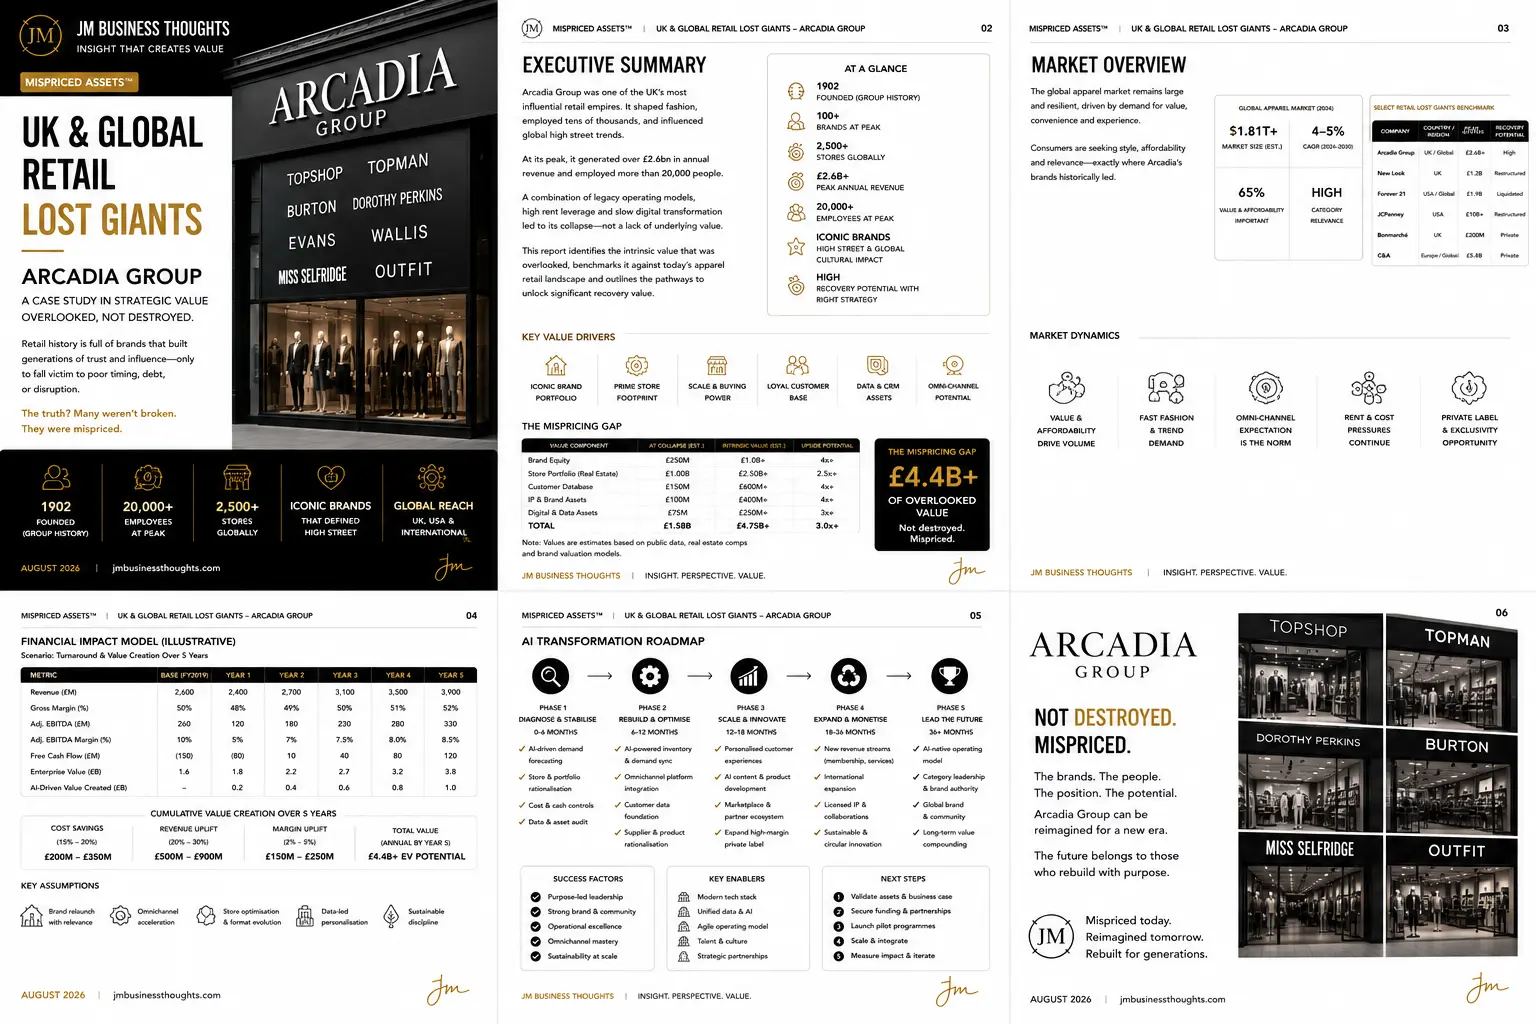
Executive summary: an empire that shaped the high street

Arcadia Group was one of the UK’s most influential retail empires. It shaped fashion, employed tens of thousands and influenced global high street trends.

At its peak it generated over £2.6BN in annual revenue and employed more than 20,000 people across 2,500+ stores globally.

A combination of legacy operating models, high rent leverage and slow digital transformation led to its collapse — not a lack of underlying value.

This report identifies the intrinsic value that was overlooked, benchmarks it against today’s apparel retail landscape and outlines the pathways to unlock significant recovery value.

Key value drivers: an iconic brand portfolio, prime store footprint, scale and buying power, a loyal customer base, data and CRM assets, and omni-channel potential.

£1.58BN at collapse against £4.75BN+ of intrinsic value. A £4.4BN+ mispricing gap.
  • 1902 group history; 100+ brands at peak
  • 2,500+ stores globally; £2.6BN+ peak annual revenue
  • 20,000+ employees at peak
  • Iconic brands with high street and global cultural impact
02

The mispricing gap: component by component

Each Arcadia asset class has a market comparator, and each was written down far below it.

Brand equity: £250M at collapse against £1.0BN+ intrinsic — 4x upside. Topshop’s cultural authority in the 2000s and 2010s is the kind of positioning fast fashion spends a decade and a billion pounds attempting to buy.

Store portfolio and real estate: £1.00BN against £2.50BN+ — 2.5x. Prime high street and flagship positions were disposed of into the worst property market in a generation.

Customer database: £150M against £600M+ — 4x. Millions of records across eight brands and multiple demographics, never unified into a single customer view.

IP and brand assets: £100M against £400M+ — 4x. Trademarks, design archives and licensing rights with global recognition.

Digital and data assets: £75M against £250M+ — 3x. Platforms, traffic and commerce infrastructure sold in fragments.

Total: £1.58BN against £4.75BN+ — a £4.4BN+ gap of overlooked value, at a 3.0x aggregate multiple. Values are estimates based on public data, real estate comparables and brand valuation models.

£4.4BN+ of overlooked value. Not destroyed. Mispriced.
  • Brand equity: £250M → £1.0BN+ (4x)
  • Store portfolio and real estate: £1.00BN → £2.50BN+ (2.5x)
  • Customer database: £150M → £600M+ (4x)
  • IP and brand assets: £100M → £400M+ (4x)
  • Digital and data assets: £75M → £250M+ (3x)
03

Market overview: $1.81TN and still growing

The global apparel market remains large and resilient, driven by demand for value, convenience and experience. Consumers are seeking style, affordability and relevance — exactly where Arcadia’s brands historically led.

Market size is estimated at $1.81TN+ with a 4–5% CAGR. Sixty-five percent of consumers rate value and affordability as important, and category relevance for Arcadia’s brand set remains high.

The lost giants benchmark: Arcadia Group, UK and global, £2.6BN+ peak, high recovery potential. New Look, UK, £1.2BN, restructured. Forever 21, USA and global, £1.9BN, liquidated. JCPenney, USA, £108M, restructured. Bonmarché, UK, £200M, private. C&A, Europe and global, £5.4BN, private.

Market dynamics: value and affordability drive volume; fast fashion and trend demand persist; omni-channel expectation is now the norm; rent and cost pressures continue; and private label plus exclusivity is the margin opportunity.

The brands sit precisely where demand concentrated. The infrastructure around them did not follow.

$1.81TN market growing 4–5% — with 65% of consumers prioritising value and affordability.
  • Global apparel market: $1.81TN+, 4–5% CAGR
  • 65% of consumers prioritise value and affordability
  • Arcadia benchmarked against New Look, Forever 21, JCPenney, C&A
  • Omni-channel expectation is the norm; private label is the margin lever
04

Where the value actually leaked

Four structural leaks explain how £2.6BN of revenue produced a 10% EBITDA margin and then nothing.

Rent leverage is the first. A 2,500-store estate on legacy upward-only leases converts any revenue decline directly into operating loss, with no variable cost to flex.

Portfolio overlap is the second. Eight core brands with overlapping ranges, duplicated supply chains and competing for the same customer wallet — without a unified customer view to see it happening.

Digital underinvestment is the third. Online competitors built recommendation, personalisation and returns economics while Arcadia treated e-commerce as a channel rather than the operating system.

Inventory and markdown is the fourth. Fashion inventory carries the steepest depreciation curve in retail; without AI-led demand forecasting and allocation, terminal stock is a permanent margin transfer.

  • Rent gap: upward-only legacy leases with no variable cost flex
  • Portfolio gap: eight brands, overlapping ranges, no single customer view
  • Digital gap: e-commerce as a channel rather than the operating model
  • Inventory gap: fashion depreciation without forecasting or allocation intelligence
05

Financial impact model: base FY2019 to Year 5

The illustrative model runs a turnaround and value creation scenario over five years from a base FY2019.

Revenue (£M): 2,600 → 2,400 → 2,700 → 3,100 → 3,500 → 3,900. Gross margin: 50% → 48% → 49% → 50% → 51% → 52%.

Adjusted EBITDA (£M): 260 → 120 → 180 → 230 → 280 → 330, with margin moving 10% → 5% → 7% → 7.5% → 8.0% → 8.5%. Free cash flow (£M): (150) → (80) → 10 → 40 → 80 → 120.

Enterprise value (£BN): 1.6 → 1.8 → 2.2 → 2.7 → 3.2 → 3.8, with AI-driven value created (£BN) of — → 0.2 → 0.4 → 0.6 → 0.8 → 1.0.

Cumulative value creation over five years: cost savings of 15–20% worth £200M – £350M; revenue uplift of 20–30% worth £500M – £900M; margin uplift of 2–5% worth £150M – £250M; total value by year five of £4.4BN+ of enterprise value potential.

Key assumptions: a brand relaunch with relevance, omnichannel acceleration, store optimisation and format evolution, data-led personalisation and sustainable discipline.

Revenue £2.6BN → £3.9BN. Enterprise value £1.6BN → £4.4BN+ potential.
  • Revenue (£M): 2,600 → 2,400 → 2,700 → 3,100 → 3,500 → 3,900
  • Adjusted EBITDA (£M): 260 → 120 → 180 → 230 → 280 → 330
  • Free cash flow (£M): (150) → (80) → 10 → 40 → 80 → 120
  • Enterprise value (£BN): 1.6 → 3.8, with £4.4BN+ potential
  • Cost savings £200M – £350M; revenue uplift £500M – £900M
06

AI transformation roadmap: five phases

Phase 1 (0–6 months) — Diagnose and stabilise: AI-driven demand forecasting, store and portfolio rationalisation, cost and cash controls, data and asset audit.

Phase 2 (6–12 months) — Rebuild and optimise: AI-powered inventory and demand sync, omnichannel platform integration, customer data foundation, supplier and product rationalisation.

Phase 3 (12–18 months) — Scale and innovate: personalised customer experiences, AI content and product development, marketplace and partner ecosystem, expansion of high-margin private label.

Phase 4 (18–36 months) — Expand and monetise: new revenue streams across membership and services, international expansion, licensed IP and collaborations, sustainable and circular innovation.

Phase 5 (36+ months) — Lead the future: an AI-native operating model, category leadership and brand authority, global brand and community, long-term value compounding.

Success factors: purpose-led leadership, strong brand and community, operational excellence, omnichannel mastery and sustainability at scale. Key enablers: a modern tech stack, unified data and AI, an agile operating model, talent and culture, and strategic partnerships. Next steps: validate assets and business case, secure funding and partnerships, launch pilot programmes, scale and integrate, and measure impact and iterate.
Mispriced today. Reimagined tomorrow. Rebuilt for generations.

The Multiplier Framework

7 compounding levers

Seven AI multipliers rebuilding a multi-brand fashion platform on unified data — aggregating to £200M – £350M of annual cost savings, £500M – £900M of revenue uplift and £4.4BN+ of enterprise value potential by year five.

01

Personalisation & Customer Experience

One customer view across eight brands instead of eight fragments.

  • Unified customer data platform across the portfolio
  • AI segmentation and next-best-action
  • Cross-brand lifecycle journeys

Outcome · £150M – £250M per year

02

Demand Forecasting & Allocation

Cut terminal stock on the steepest depreciation curve in retail.

  • AI demand forecasting by brand, store and size curve
  • Dynamic allocation and replenishment
  • Markdown and terminal-stock optimisation

Outcome · £120M – £200M per year

03

Pricing & Margin Intelligence

Protect gross margin against promotional drift.

  • AI price elasticity by brand and category
  • Promotion effectiveness modelling
  • Competitive and trend-based repricing

Outcome · £100M – £180M per year

04

Store Portfolio & Format Intelligence

Right estate, right format, right lease terms.

  • Trade area and catchment modelling
  • Format performance benchmarking
  • Lease and capital allocation analytics

Outcome · £80M – £150M per year

05

Supply Chain & Private Label

Faster cycles and higher-margin exclusive product.

  • Supplier performance and lead-time intelligence
  • AI-assisted design and range architecture
  • Private label margin expansion

Outcome · £100M – £180M per year

06

Digital Commerce & Marketplace

Omnichannel as the operating model, not a channel.

  • Semantic search and AI merchandising
  • Marketplace and partner ecosystem
  • Returns economics and fit intelligence

Outcome · £120M – £220M per year

07

Data & Decision Intelligence

Portfolio decisions on evidence, across every brand at once.

  • Unified group data platform
  • Executive dashboards and anomaly detection
  • Scenario modelling on trend, cost and demand

Outcome · £60M – £120M per year

Arcadia Group: The Value Wasn’t Lost. It Was Mispriced. full strategic breakdown
Mispriced Assets™ · UK & Global Retail Lost Giants — Arcadia Group: the full six-page institutional report covering the cover and key value drivers, executive summary with the at-a-glance estate and the mispricing gap table, global apparel market overview and lost giants benchmark, the five-year financial impact model with key assumptions, the five-phase AI transformation roadmap, and the closing brand portfolio case.

The Verdict

Topshop, Topman, Burton, Dorothy Perkins, Evans, Wallis, Miss Selfridge and Outfit — 2,500+ stores, £2.6BN+ of revenue and 20,000+ people, written down to £1.58BN against £4.75BN+ of intrinsic value. The empire collapsed; the brand equity did not. Rent leverage, portfolio overlap and digital underinvestment failed, in a $1.81TN apparel market still growing 4–5%. Seven multipliers rebuild the group on unified data for £500M – £900M of revenue uplift and £4.4BN+ of enterprise value. The brands. The people. The position. The potential.

JM founder signature
68 · PureGym — Fitness At Scale. More Personal. More Inclusive.67 · SIXT — Smarter Mobility. Greater Availability. A More Connected Tomorrow.66 · Sendwave — Money That Moves With Intelligence.65 · McDonald’s — Serving The Future With AI.64 · Compare the Market — Smarter Comparison. Better Matches. Brighter Tomorrows.63 · WeBuyAnyCar — Smarter Pricing. Faster Offers. Better Conversion.62 · Primark — Affordable Fashion. Greater Possibilities With AI.61 · Starbucks — Smarter Stores. Stronger Loyalty. Better Margins.60 · IKEA — AI-Powered Home Retail at Global Scale59 · H&M — Smarter Fashion. Brighter Tomorrow.58 · WeWork — The Value Wasn't Lost. It Was Mispriced.57 · Yahoo — The Value Wasn't Lost. It Was Mispriced.56 · Nando's UK — Smarter Restaurants. Stronger Loyalty. Better Margins.55 · The Amplifier54 · The Body Shop51 · Blockbuster50 · Carpetright49 · Wilko48 · Mothercare47 · Phones 4u46 · Farfetch45 · Jumia44 · Toys ‘R’ Us43 · The Collateral Gap — Part One41 · The Amplifier40 · Africa Bee Farming39 · Kenya Airways38 · Africa Greenhouse Farming37 · Uganda Tourism Board36 · Boots UK35 · Biffa (UK)34 · NatWest33 · Skip Hire Companies UK33 · The Audit32 · The Lean Company31 · Africa Mushroom Farming29 · The Rider Economy Nobody Verified28 · The Layer Underneath the Layer27 · Independent Timber Yards & Jewson Timber26 · Link Up TV & GRM Daily25 · East African Portland Cement42 · International Student Credential & Financial Verification — Part One24 · The Supply Chain Inside the Supply Chain23 · The White Space, Mapped22 · The Real Opportunity21 · Greencore20 · West Ham United19 · Roofings Group Uganda18 · Mombasa Port17 · Auto Trader UK16 · Uganda Coffee Development Authority15 · Brookside Dairy14 · GraceKennedy13 · Rightmove12 · Manchester United11 · Greggs30 · Twiga Foods10 · Uchumi09 · Konga08 · Edcon09 · GAME07 · Debenhams06 · Claire's05 · Boohoo04 · Argos