
Yahoo — The Value Wasn't Lost. It Was Mispriced. research poster
All Research
57Mispriced Assets™ 18 min readSeptember 2026
Coverage · Global · Institutional CoverageSector · Digital Media, Search & Consumer InternetFormat · Six-page audit

Yahoo — The Value Wasn't Lost. It Was Mispriced.An iconic brand. A vast audience. A mispriced digital platform.

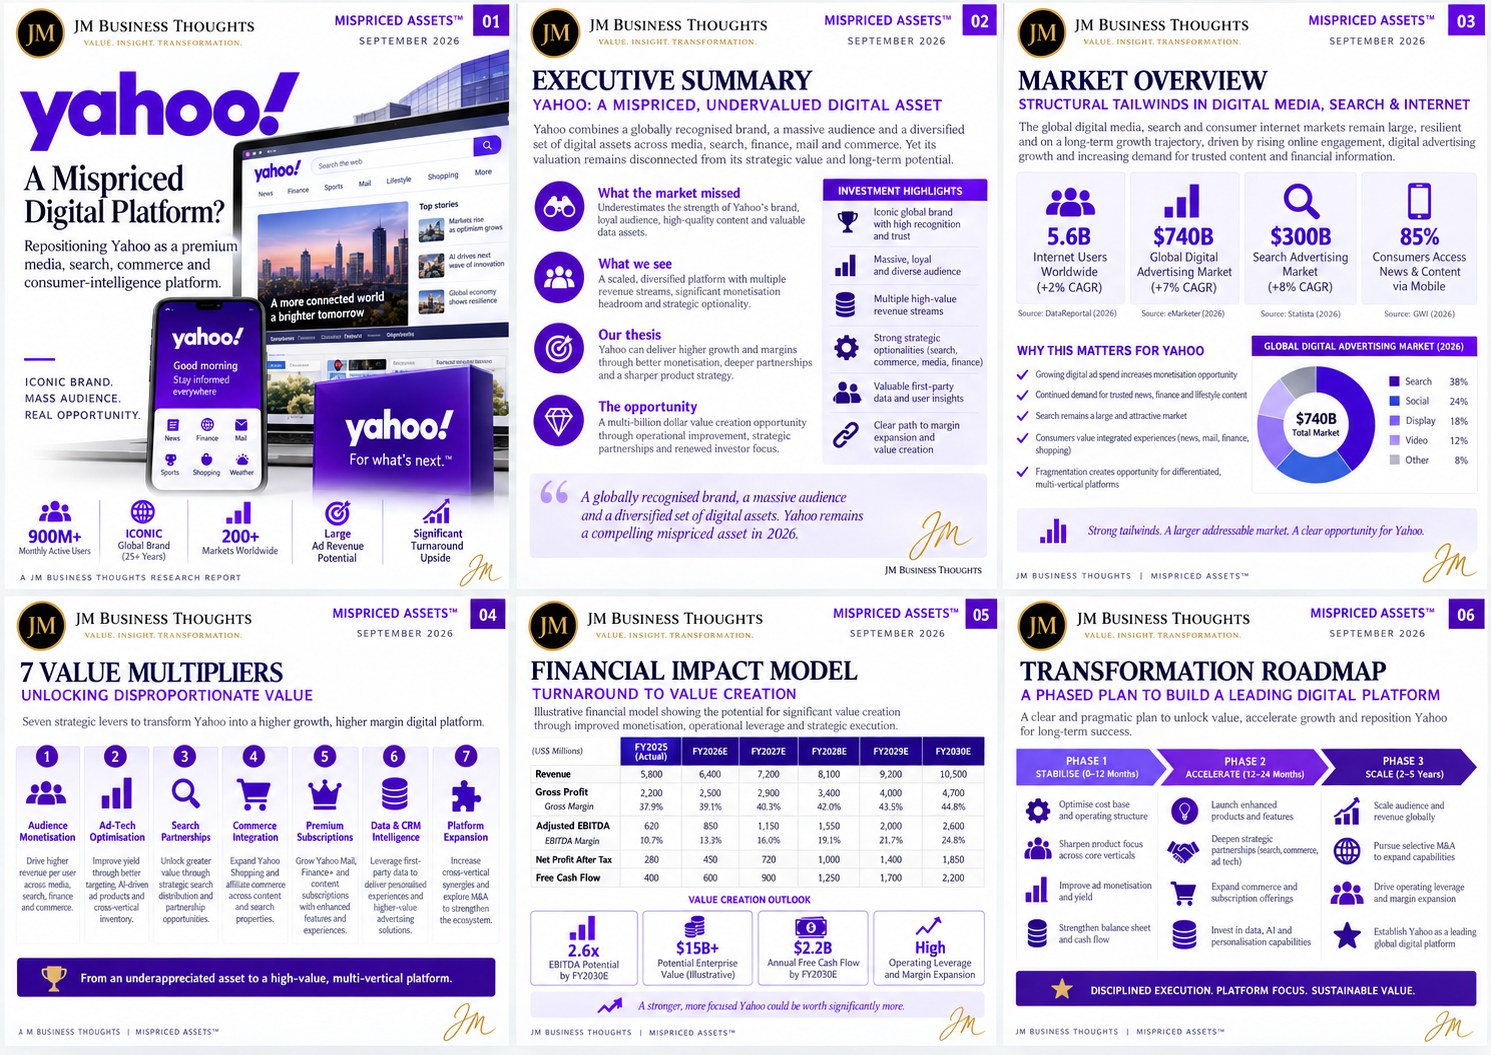
Yahoo combines a globally recognised brand, 900M+ monthly active users and a diversified set of digital assets across media, search, finance, mail and commerce — yet its valuation remains disconnected from its strategic value. This study repositions Yahoo as a premium media, search, commerce and consumer-intelligence platform, sizing a path to 2.6x EBITDA potential, $15B+ potential enterprise value and $2.2B annual free cash flow by FY2030E through seven value multipliers and a three-phase transformation plan.

Monthly Active Users

900M+

Global Brand Age

25+ Years

Markets Worldwide

200+

FY2025 Revenue

$5.8BN

FY2030E Revenue

$10.5BN

EBITDA Potential

2.6x by FY2030E

Potential Enterprise Value

$15BN+

FCF by FY2030E

$2.2BN

The Thesis

Yahoo is the clearest live example of the Mispriced Assets™ thesis: value that was overlooked, not destroyed. The market prices Yahoo against its lost search war of two decades ago. What it actually owns today is a globally recognised brand with 25+ years of trust, 900M+ monthly active users across 200+ markets, and a diversified portfolio spanning news, finance, mail, sports, shopping and weather — each with distinct monetisation headroom and first-party data value. The market misses three things: it underestimates brand and audience quality, it treats a multi-vertical platform as a single declining property, and it prices in no credit for the ad-tech, commerce and subscription optionality already inside the business. On an illustrative model, disciplined monetisation, operating leverage and sharper product focus take revenue from $5.8bn to $10.5bn and adjusted EBITDA margin from 10.7% to 24.8% by FY2030E — a 2.6x EBITDA outcome and $15B+ of potential enterprise value. The value wasn't lost. It was mispriced.

Exhibit · Report Cover

57 · Mispriced Assets™

Yahoo — The Value Wasn't Lost. It Was Mispriced. report cover
Yahoo — The Value Wasn't Lost. It Was Mispriced.September 2026 · Global · Institutional Coverage
01

Executive summary — a mispriced, undervalued digital asset

Yahoo combines a globally recognised brand, a massive audience and a diversified set of digital assets across media, search, finance, mail and commerce. Its valuation remains disconnected from that strategic value and long-term potential.

What the market missed: it underestimates the strength of Yahoo's brand, the loyalty of its audience, the quality of its content and the value of its data assets.

What we see: a scaled, diversified platform with multiple revenue streams, significant monetisation headroom and clear strategic optionality across search, commerce, media and finance.

The opportunity: a multi-billion-dollar value creation opportunity through operational improvement, strategic partnerships and renewed investor focus — with a clear path to margin expansion and value creation.

A globally recognised brand, a massive audience and a diversified set of digital assets. Yahoo remains a compelling mispriced asset in 2026.
  • Iconic global brand with high recognition and trust
  • Massive, loyal and diverse audience across 200+ markets
  • Multiple high-value revenue streams, not one declining property
  • Valuable first-party data and user insight
02

Market overview — structural tailwinds, not structural decline

The global digital media, search and consumer internet markets remain large, resilient and on a long-term growth trajectory, driven by rising online engagement, digital advertising growth and increasing demand for trusted content and financial information.

5.6B internet users worldwide (+2% CAGR); a $740B global digital advertising market (+7% CAGR); a $300B search advertising market (+8% CAGR); and 85% of consumers accessing news and content via mobile.

Within the $740B advertising market, search takes 38%, social 24%, display 18%, video 12% and other 8% — meaning the two categories Yahoo is structurally present in represent the majority of spend.

Why this matters for Yahoo: growing digital ad spend increases monetisable opportunity; demand for trusted news, finance and lifestyle content continues; search remains large and attractive; consumers value integrated experiences across news, mail, finance and shopping; and fragmentation creates room for differentiated, multi-vertical platforms.

Strong tailwinds. A larger addressable market. A clear opportunity for Yahoo.
  • 5.6B internet users worldwide (+2% CAGR) · DataReportal 2026
  • $740B global digital advertising market (+7% CAGR) · eMarketer 2026
  • $300B search advertising market (+8% CAGR) · Statista 2026
  • 85% of consumers access news and content via mobile · GWI 2026
03

The mispricing — why an iconic asset trades below its parts

Mispricing in digital media rarely comes from bad assets. It comes from a narrative that hardened before the asset changed. Yahoo's narrative hardened around a search battle it lost in the 2000s; the balance sheet reality is a multi-vertical consumer platform with 900M+ monthly users.

A sum-of-the-parts reading separates media, finance, mail, search partnerships, commerce and ad-tech into distinct businesses with distinct multiples. Blended into one legacy label, each of them is priced as the weakest.

The audience is the asset the market cannot rebuild. Reach at 900M+ monthly actives across 200+ markets, with logged-in identity through mail and finance, is a first-party data position most challengers spend a decade and billions attempting to assemble.

The correction mechanism is not a rebrand. It is disclosure, focus and demonstrated margin: report the verticals separately, prove yield improvement, and let the multiple follow the economics.

Value overlooked, not destroyed — the definition of a mispriced asset.
  • Narrative anchored to a two-decade-old search outcome
  • Multi-vertical platform priced as a single declining property
  • Logged-in identity through mail and finance is the hardest asset to replicate
  • Re-rating requires segment disclosure and demonstrated yield, not repositioning language
04

Seven value multipliers — unlocking disproportionate value

Seven strategic levers transform Yahoo into a higher-growth, higher-margin digital platform: audience monetisation, ad-tech optimisation, search partnerships, commerce integration, premium subscriptions, data and CRM intelligence, and platform expansion.

Audience monetisation drives higher revenue per user across media, search, finance and commerce. Ad-tech optimisation improves yield through better targeting, AI-driven ad products and cross-vertical inventory.

Search partnerships unlock greater value through strategic search distribution and partnership opportunities. Commerce integration expands Yahoo Shopping and affiliate commerce across content and search properties.

Premium subscriptions grow Yahoo Mail, Finance+ and content subscriptions with enhanced features and experiences. Data and CRM intelligence leverages first-party data for personalised advertising and higher-value solutions. Platform expansion increases cross-vertical synergies and explores selective M&A to strengthen the ecosystem.

From an underappreciated asset to a high-value, multi-vertical platform.
  • 01 Audience Monetisation · 02 Ad-Tech Optimisation · 03 Search Partnerships
  • 04 Commerce Integration · 05 Premium Subscriptions
  • 06 Data & CRM Intelligence · 07 Platform Expansion
  • Each lever is independently defensible and collectively compounding
05

Financial impact model — turnaround to value creation

Illustrative model: revenue moves from $5,800m (FY2025 actual) to $6,400m, $7,200m, $8,100m, $9,200m and $10,500m across FY2026E–FY2030E.

Gross profit rises from $2,200m (37.9%) to $4,700m (44.8%) as higher-yield advertising, subscriptions and commerce shift the mix.

Adjusted EBITDA moves from $620m (10.7% margin) to $2,600m (24.8% margin) — the 2.6x EBITDA potential at the centre of the thesis. Net profit after tax rises from $280m to $1,850m.

Free cash flow strengthens from $400m to $2,200m by FY2030E, supporting a potential enterprise value of $15B+ on an illustrative basis. A stronger, more focused Yahoo could be worth significantly more.

2.6x EBITDA potential. $15B+ potential enterprise value. $2.2B annual free cash flow by FY2030E.
  • Revenue $5.8bn → $10.5bn (FY2025 → FY2030E)
  • Gross margin 37.9% → 44.8%
  • Adjusted EBITDA margin 10.7% → 24.8%
  • Free cash flow $400m → $2,200m
06

Transformation roadmap — stabilise, accelerate, scale

Phase 1 · Stabilise (0–12 months): optimise the cost base and operating structure, sharpen product focus across core verticals, improve ad monetisation and yield, and strengthen the balance sheet and cash flow.

Phase 2 · Accelerate (12–24 months): launch enhanced products and services, deepen strategic partnerships across search, commerce and ad-tech, expand commerce and subscription offerings, and invest in data, AI and personalisation capabilities.

Phase 3 · Scale (2–5 years): scale audience and revenue globally, pursue selective M&A to expand capabilities, drive operating leverage and margin expansion, and establish Yahoo as a leading global digital platform.

The sequencing matters: cost and disclosure discipline first buys the credibility required for the growth investment in Phase 2, and the multiple re-rates on demonstrated margin in Phase 3 — not on announcement.

Disciplined execution. Platform focus. Sustainable value.
  • Phase 1 Stabilise · 0–12 months
  • Phase 2 Accelerate · 12–24 months
  • Phase 3 Scale · 2–5 years
  • Re-rating follows demonstrated margin, not messaging
07

Sources and method

Market sizing: DataReportal (2026) for internet users; eMarketer (2026) for global digital advertising; Statista (2026) for search advertising; GWI (2026) for mobile content access.

Company positioning and audience: publicly reported Yahoo audience and market presence data; JM Business Thoughts analysis.

Financial model: illustrative JM Business Thoughts model showing the potential for value creation through improved monetisation, operating leverage and strategic execution. Figures are illustrative, not forecast, and are not company guidance.

Method note: each multiplier is sized against the disclosed revenue base and netted for overlap before the aggregate margin path is stated.

The Multiplier Framework

7 compounding levers

Seven strategic levers to transform Yahoo into a higher-growth, higher-margin digital platform.

01

Audience Monetisation

Drive higher revenue per user across media, search, finance and commerce.

  • Raise ARPU across the 900M+ monthly active base
  • Close the monetisation gap between verticals
  • Move engagement into logged-in, identified sessions

Outcome · The largest owned audience in mispriced digital media starts earning like one.
02

Ad-Tech Optimisation

Improve yield through better targeting, AI-driven ad products and cross-vertical inventory.

  • Deploy AI-driven creative, targeting and pricing
  • Pool inventory across news, finance, mail and sports
  • Compete on yield per impression, not volume

Outcome · Existing traffic produces materially more revenue with no additional audience cost.

03

Search Partnerships

Unlock greater value through strategic search distribution and partnerships.

  • Renegotiate and expand distribution economics
  • Package search alongside finance and news intent data
  • Target the $300B search advertising market selectively, not universally

Outcome · Search becomes a partnership annuity rather than an unwinnable frontal war.

04

Commerce Integration

Expand Yahoo Shopping and affiliate commerce across content and search properties.

  • Embed commerce into editorial and finance journeys
  • Scale affiliate and retail media inventory
  • Attribute transactions back to first-party identity

Outcome · Content traffic converts into transaction margin instead of leaking to third parties.

05

Premium Subscriptions

Grow Yahoo Mail, Finance+ and content subscriptions with enhanced features.

  • Tier Mail and Finance around genuinely premium capability
  • Bundle across verticals to raise retention
  • Convert high-frequency free users on utility, not paywalls

Outcome · Recurring revenue de-risks the advertising cycle and supports a higher multiple.

06

Data & CRM Intelligence

Leverage first-party data for personalised advertising and higher-value solutions.

  • Unify identity across mail, finance, sports and shopping
  • Build privacy-safe audience products for advertisers
  • Price data-backed inventory at a premium

Outcome · A first-party data position competitors cannot buy becomes a priced product line.

07

Platform Expansion

Increase cross-vertical synergies and explore selective M&A to strengthen the ecosystem.

  • Route users between verticals deliberately, not accidentally
  • Acquire capability gaps in ad-tech, commerce and AI
  • Report verticals separately so the market can price them separately

Outcome · Sum-of-the-parts value becomes visible — the mechanism by which mispricing corrects.

Yahoo — The Value Wasn't Lost. It Was Mispriced. full strategic breakdown
Yahoo · Mispriced Assets™ — full six-page brief: 01 Cover, 02 Executive Summary and investment highlights, 03 Market Overview with digital advertising breakdown, 04 The 7 Value Multipliers, 05 Financial Impact Model FY2025–FY2030E, 06 Transformation Roadmap.

The Verdict

Yahoo is not a broken business priced correctly; it is a diversified one priced by an obsolete story. A 25-year global brand, 900M+ monthly active users across 200+ markets, logged-in identity through mail and finance, and revenue lines spanning media, search, commerce and subscriptions constitute a platform the market has never valued as a platform. On an illustrative basis, execution across seven multipliers takes revenue from $5.8bn to $10.5bn, adjusted EBITDA margin from 10.7% to 24.8%, and free cash flow from $400m to $2.2bn by FY2030E — a 2.6x EBITDA outcome and $15B+ of potential enterprise value. The correction requires no reinvention, only disclosure, focus and demonstrated margin. The value wasn't lost. It was mispriced.

JM founder signature
68 · PureGym — Fitness At Scale. More Personal. More Inclusive.67 · SIXT — Smarter Mobility. Greater Availability. A More Connected Tomorrow.66 · Sendwave — Money That Moves With Intelligence.65 · McDonald’s — Serving The Future With AI.64 · Compare the Market — Smarter Comparison. Better Matches. Brighter Tomorrows.63 · WeBuyAnyCar — Smarter Pricing. Faster Offers. Better Conversion.62 · Primark — Affordable Fashion. Greater Possibilities With AI.61 · Starbucks — Smarter Stores. Stronger Loyalty. Better Margins.60 · IKEA — AI-Powered Home Retail at Global Scale59 · H&M — Smarter Fashion. Brighter Tomorrow.58 · WeWork — The Value Wasn't Lost. It Was Mispriced.55 · The Amplifier54 · The Body Shop53 · Arcadia Group52 · Cazoo51 · Blockbuster50 · Carpetright49 · Wilko48 · Mothercare47 · Phones 4u46 · Farfetch45 · Jumia44 · Toys ‘R’ Us43 · The Collateral Gap — Part One41 · The Amplifier40 · Africa Bee Farming39 · Kenya Airways38 · Africa Greenhouse Farming37 · Uganda Tourism Board36 · Boots UK35 · Biffa (UK)34 · NatWest33 · Skip Hire Companies UK33 · The Audit32 · The Lean Company31 · Africa Mushroom Farming29 · The Rider Economy Nobody Verified28 · The Layer Underneath the Layer27 · Independent Timber Yards & Jewson Timber26 · Link Up TV & GRM Daily25 · East African Portland Cement42 · International Student Credential & Financial Verification — Part One24 · The Supply Chain Inside the Supply Chain23 · The White Space, Mapped22 · The Real Opportunity21 · Greencore20 · West Ham United19 · Roofings Group Uganda18 · Mombasa Port17 · Auto Trader UK16 · Uganda Coffee Development Authority15 · Brookside Dairy14 · GraceKennedy13 · Rightmove12 · Manchester United11 · Greggs30 · Twiga Foods10 · Uchumi09 · Konga08 · Edcon09 · GAME07 · Debenhams06 · Claire's05 · Boohoo04 · Argos