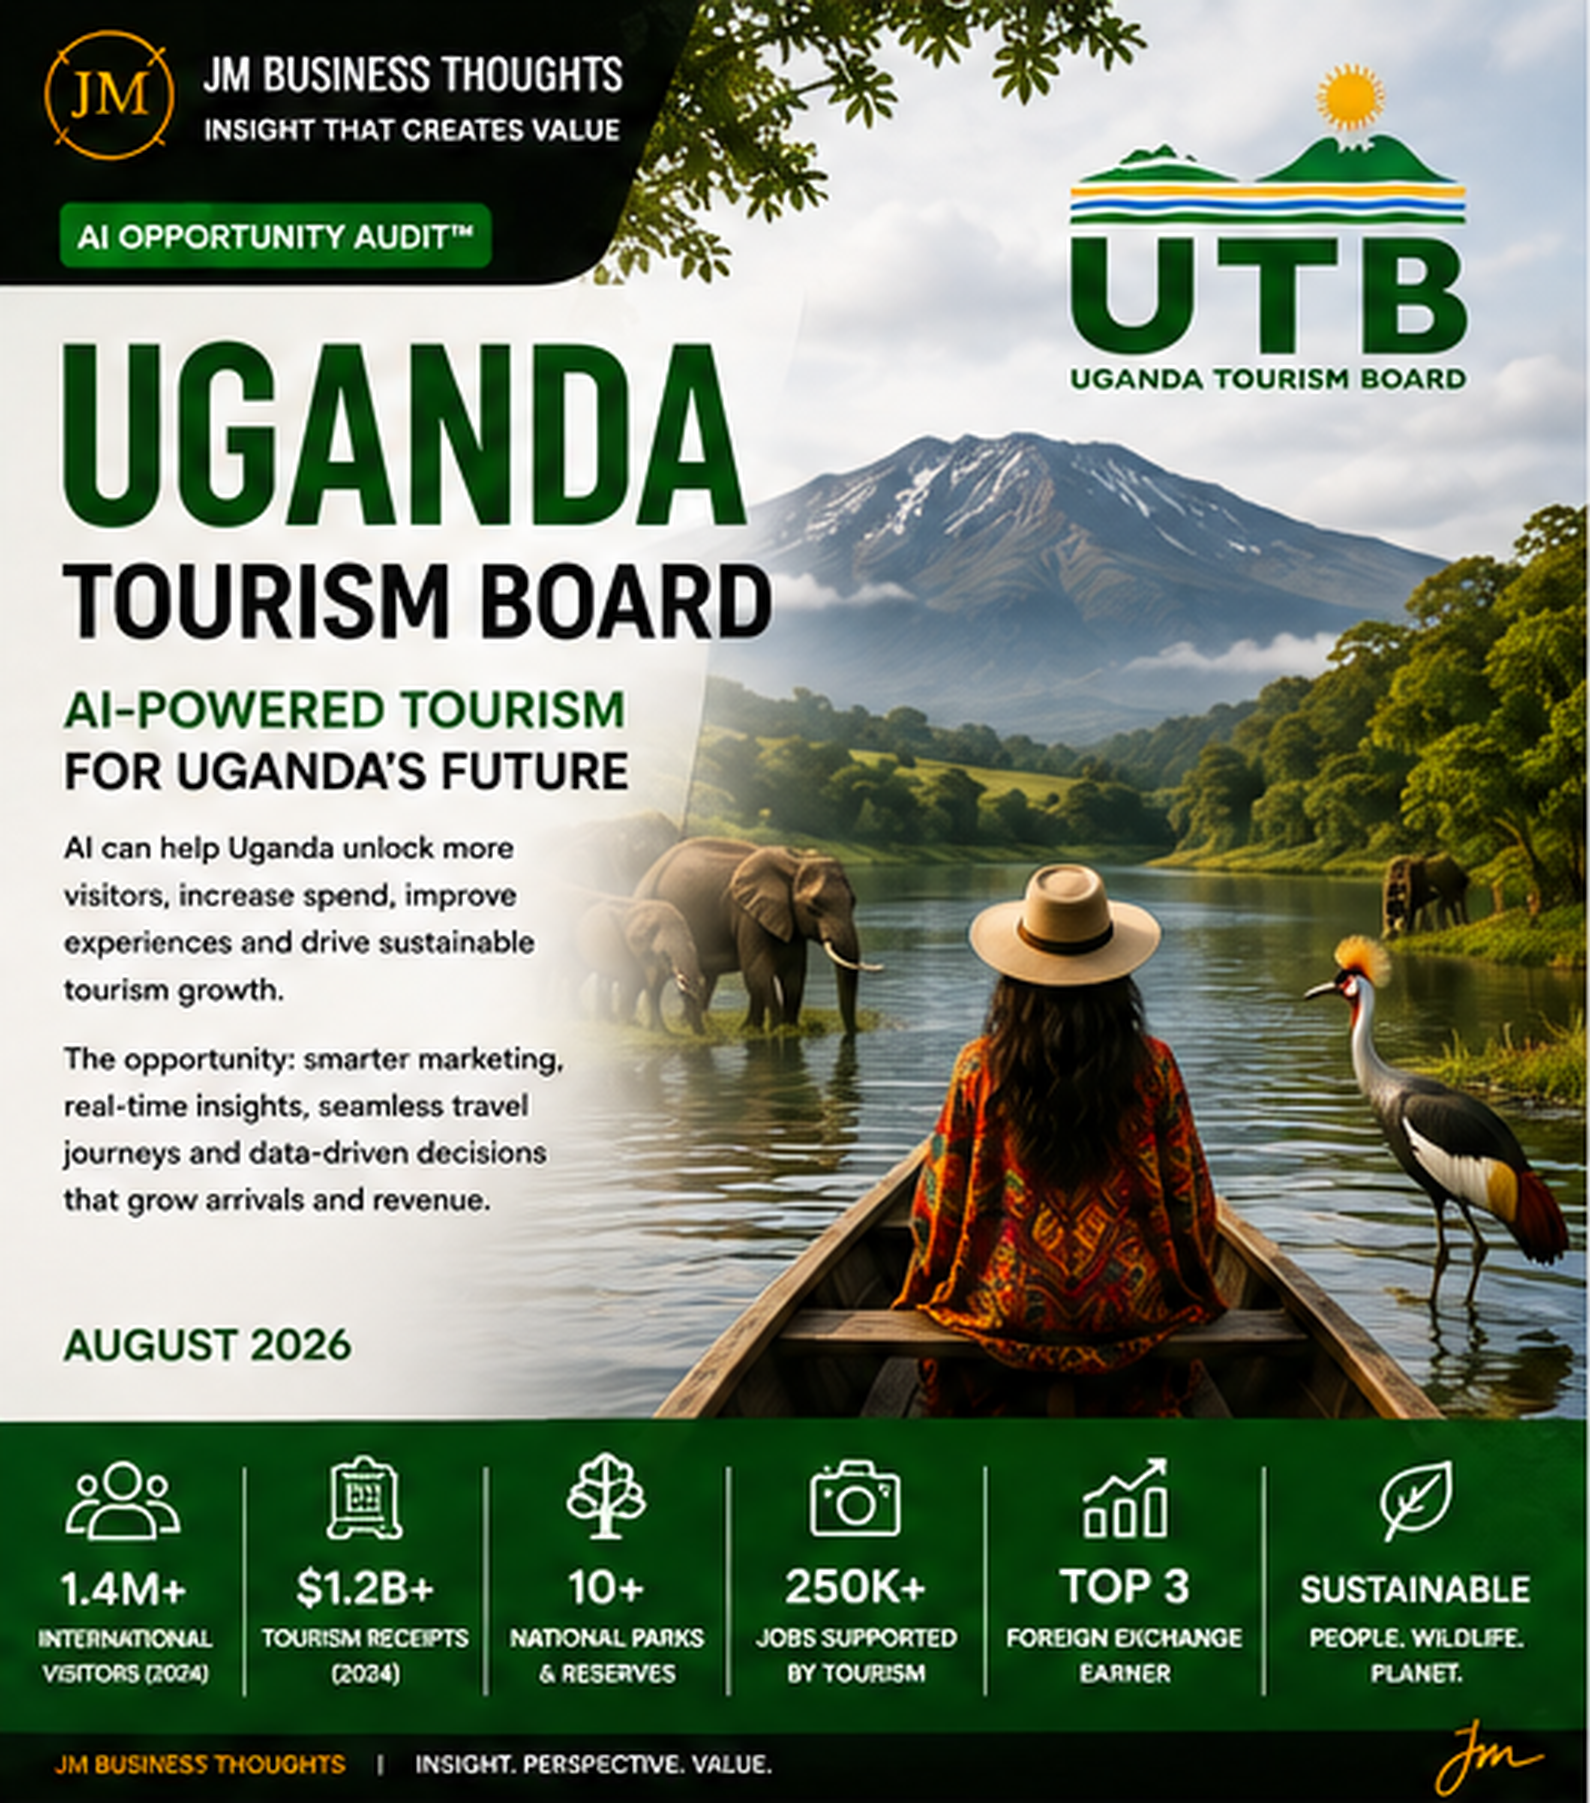
Uganda Tourism Board: AI-Powered Tourism For Uganda's Future. research poster
All Research

The Hidden AI Operating System Audit Series™

Where AI creates new profit pools—not just productivity.

37AI Opportunity Audit™ 18 min readAugust 2026
Coverage · Uganda · East Africa · Institutional CoverageSector · Tourism & Destination Economy · Public SectorFormat · Six-page audit

Uganda Tourism BoardMore Visitors, Higher Spend, Better Experiences — And Sustainable Growth.

An AI Opportunity Audit™ across Uganda Tourism Board's marketing, visitor services, operations, conservation and policy estate — identifying £120M – £200M+ of annual AI-driven value by 2030 against 1.4M+ international visitors and $1.2B+ in tourism receipts.

International Visitors (2024)

1.4M+

Tourism Receipts (2024)

$1.2B+

National Parks & Reserves

10+

Jobs Supported By Tourism

250K+

Foreign Exchange Rank

Top 3

Contribution To GDP

~8%

Market CAGR (2024–2030)

~7%

Annual AI Value By 2030

£120M – £200M+

The Thesis

Uganda Tourism Board is the national agency mandated to market Uganda as a premier destination and support sustainable tourism growth. It sits on an asset base almost no competitor in the region can replicate — 10+ national parks and reserves, mountain gorillas, the source of the Nile, and a tourism sector already delivering $1.2B+ in receipts, ~8% of GDP and 250K+ jobs. What it does not yet have is a data operating system. Arrivals are counted after the fact, campaigns are bought on intuition, visitor journeys are fragmented across operators, and conservation impact is reported rather than predicted. Every one of those is a prediction problem. Our analysis identifies £120M – £200M+ in annual AI-driven value by 2030 — delivered through seven multipliers, without a single new park.

Exhibit · Report Cover

37 · AI Opportunity Audit™

Uganda Tourism Board: AI-Powered Tourism For Uganda's Future. report cover
Uganda Tourism Board: AI-Powered Tourism For Uganda's Future.August 2026 · Uganda · East Africa · Institutional Coverage
01

Executive summary: a destination that markets on instinct

Uganda Tourism Board (UTB) is the national agency mandated to market Uganda as a premier tourist destination and support sustainable tourism growth. By embedding AI across marketing, visitor services, operations and policy, UTB can unlock £120M – £200M+ in annual value by 2030.

The at-a-glance position: 1.4M+ international visitors (2024), $1.2B+ in tourism receipts, 10+ national parks and major attractions, 250K+ jobs supported and a government mandate with partnership authority across the private sector. That mandate is the scarce ingredient — UTB can convene data that no single operator can assemble alone.

This report identifies seven AI value multipliers and estimates the financial and strategic impact. The value is not brochure modernisation. It is measurable: lower cost of acquisition per arrival, higher spend per visitor, longer stays, fewer safety incidents, better-funded conservation, and evidence-based policy allocation.

£120M – £200M+ per year by 2030 — on a $1.2B+ receipts base and ~8% of national GDP.
  • AI-powered marketing & campaigns: £20M – £40M / year
  • Demand forecasting & insights: £15M – £30M / year
  • Personalised visitor experiences: £20M – £35M / year
  • Smart operations & site management: £20M – £35M / year
  • Risk, safety & security intelligence: £15M – £25M / year
  • Sustainability & conservation monitoring: £10M – £20M / year
  • Data & policy decision support: £20M – £15M+ / year
02

Market overview: rebounding travel, digital-first planning

Uganda's tourism sector is a key economic driver, with significant growth potential in arrivals, receipts and job creation. Global tourism is rebounding and digital-first travel planning is now the norm — discovery, comparison, booking and post-trip advocacy all happen on platforms UTB does not own but can instrument.

The market is growing at roughly 7% CAGR through 2030, with tourism contributing approximately 8% of GDP. That growth is not automatic: it is competed for. Kenya, Rwanda, Tanzania and Zambia are all running national destination-marketing programmes, and Rwanda in particular has demonstrated how quickly a small country can reposition premium perception with disciplined brand and partnership investment.

AI adoption can position Uganda ahead of regional competitors and unlock new source markets — not by outspending them, but by out-targeting them. In a market where competitor budgets are larger, the only durable edge is conversion efficiency per marketing dollar.

~7% CAGR, ~8% of GDP, four regional competitors running national programmes — targeting beats budget.
  • International visitors (2024): 1.4M+
  • Tourism receipts (2024): $1.2B+
  • CAGR (2024–2030): ~7%
  • Contribution to GDP: ~8%
  • Competitive set: Kenya, Rwanda, Tanzania, Zambia tourism boards
03

AI maturity snapshot: early adoption, high upside

The audit scores UTB at early adoption with high upside. Data and analytics is the most promising dimension — data sources exist across immigration, park gates, operators and digital channels, but integration is missing, so no single view of the visitor exists.

AI capabilities are at pilot stage in marketing and chatbots. Technology and platforms score lowest: legacy systems and digital gaps constrain what can be deployed. Customer experience is improving as digital channels mature. Operations and management remain largely manual across permitting, capacity and site management.

People and culture is the binding constraint — skills and change management are needed before any of this scales. Overall verdict: nascent-to-developing across most dimensions, with an unusually favourable ratio of upside to invested capital because so little has been digitised.

  • Data & analytics: sources exist, integration needed
  • AI capabilities: pilots in marketing and chatbots
  • Technology & platforms: legacy systems, digital gaps
  • Customer experience: digital channels improving
  • Operations & management: manual processes in many areas
  • People & culture: skills and change management needed
04

Where the value actually leaks

The first leak is acquisition cost. UTB and its partners buy reach rather than intent. Without attribution from impression to arrival, campaign budgets are allocated on last year's assumptions, and high-yield source markets are under-served while low-yield ones absorb spend.

The second is spend per visitor. A visitor who books gorilla permits, lodging, transfers and a second park separately — through four unconnected intermediaries — spends materially less than one presented with a single AI-assembled itinerary. Average spend per visitor is the most under-managed number in the sector.

The third is capacity. Seasonality is extreme and permitting is finite. Peaks overload sites and shoulder seasons run empty, which suppresses both conservation revenue and operator profitability. Dynamic demand modelling converts that volatility into yield.

The fourth is trust. Safety incidents, fraud and inconsistent service quality damage reputation asymmetrically — one incident costs more in cancelled bookings than a quarter of marketing buys. Real-time risk intelligence is a revenue protection asset, not an overhead.

  • Acquisition gap: reach bought without intent data or arrival attribution
  • Yield gap: fragmented itineraries suppress spend per visitor and length of stay
  • Capacity gap: extreme seasonality against finite permits and park capacity
  • Trust gap: safety, fraud and service variability priced into cancellations
05

The financial impact model: base year to Year 5

The illustrative model runs full AI transformation over five years from an FY2024 base. International visitors move from 1.4M to 2.2M by Year 5. Tourism receipts move from $1.2B to $1.90B, with average spend per visitor rising from $857 to approximately $1,050.

Tourism contribution to GDP moves from 8% to 10.5%, and jobs supported rise from 250K to 350K. AI investment is front-loaded — $15M, $20M, $20M, $15M, $10M across the five years — while AI-driven value scales from $30M in Year 1 to $180M in Year 5.

Cumulative value creation over five years splits into cost savings of £40M – £60M (15–25%), revenue uplift of £50M – £80M (10–15%) and margin uplift of £20M – £40M (2–4%) — aggregating to the £120M – £200M+ annual run-rate by 2030. Payback on the cumulative $80M programme arrives inside Year 3.

Visitors 1.4M → 2.2M. Receipts $1.2B → $1.90B. Spend per visitor $857 → $1,050. GDP share 8% → 10.5%.
  • International visitors (M): 1.4 → 1.5 → 1.6 → 1.8 → 1.95 → 2.2
  • Tourism receipts ($B): 1.2 → 1.28 → 1.40 → 1.55 → 1.70 → 1.90
  • Average spend per visitor ($): 857 → 1,050
  • Jobs supported (K): 250 → 350
  • AI-driven value ($M): 30 → 60 → 100 → 150 → 180
06

Key assumptions and execution risk

The model assumes moderate tourism recovery, AI adoption over three to five years, stable global demand, continued government support, active private-sector partnerships and a sustainability-first posture.

The binding constraint is institutional, not technical. UTB does not own most of the data it needs — airlines, operators, lodges, park authorities and payment providers do. The programme succeeds only if UTB uses its convening mandate to establish shared data standards and a public-private data trust early, with clear rules on ownership, consent and commercial use.

Success factors are strong leadership and vision, cross-sector collaboration, quality data and platforms, a continuous learning culture, and a customer-centric approach. Key enablers: modern data infrastructure, cloud and AI platforms, skilled talent and upskilling, public-private partnerships and sustainable funding.

  • Moderate tourism recovery; AI adoption across 3–5 years
  • Stable global demand and continued government support
  • Private-sector partnerships and shared data standards established early
  • Sustainability prioritised across conservation and community outcomes
07

AI transformation roadmap: five phases to 2030

Phase 1 (0–6 months) — Foundation: data and integration, data governance, identify quick-win use cases, baseline KPIs and dashboards.

Phase 2 (6–12 months) — Pilots and capability: launch pilot projects across marketing, chatbot and demand forecasting; upskill teams; develop the AI governance framework.

Phase 3 (13–24 months) — Scale and integrate: scale successful pilots, integrate platforms and data systems, enhance the digital visitor experience end to end.

Phase 4 (24–36 months) — Optimise and expand: optimise operations and site management, expand AI to new use cases, strengthen sustainability monitoring.

Phase 5 (36+ months) — Lead and innovate: an AI-powered ecosystem, predictive policy and investment, and positioning Uganda as the region's AI tourism leader.

Next steps are sequential: validate priority use cases, secure funding and partnerships, launch pilot programmes, scale and integrate, then measure impact and iterate.
Smarter tourism. Stronger economy. Sustainable Uganda.

The Multiplier Framework

7 compounding levers

Seven AI multipliers, each with a defined mechanism, application set and annual value range — aggregating to £120M – £200M+ of AI-driven value per year by 2030.

01

AI-Powered Marketing & Campaigns

Reach the right audiences, personalise messaging and improve return on marketing investment.

  • Programmatic ads targeted on travel intent signals
  • AI-generated content across source-market languages
  • Influencer and partner targeting by yield, not reach

Outcome · £20M – £40M per year

02

Demand Forecasting & Insights

Predict demand, optimise pricing and time promotions against real seasonality.

  • Arrival forecasting models by source market
  • Market segmentation and trend analysis
  • Shoulder-season promotion planning

Outcome · £15M – £30M per year

03

Personalised Visitor Experiences

Tailor itineraries and recommendations to raise spend, length of stay and repeat visits.

  • AI trip planner across parks, lodges and transfers
  • Multilingual chatbots for pre-arrival and in-country support
  • Personalised offers tied to interests and budget

Outcome · £20M – £35M per year

04

Smart Operations & Site Management

Improve efficiency, reduce costs and manage carrying capacity across parks and attractions.

  • Predictive maintenance across facilities and fleet
  • Workforce optimisation at gates and visitor centres
  • Real-time capacity and permit tracking

Outcome · £20M – £35M per year

05

Risk, Safety & Security Intelligence

Protect visitor safety and destination reputation with real-time alerts.

  • AI surveillance and anomaly detection at key sites
  • Crisis response and incident coordination
  • Booking and payment fraud control

Outcome · £15M – £25M per year

06

Sustainability & Conservation Monitoring

Monitor environmental impact and support conservation with measurable evidence.

  • AI for wildlife tracking and anti-poaching analytics
  • Habitat and ecosystem change detection
  • Waste, water and emissions monitoring

Outcome · £10M – £20M per year

07

Data & Policy Decision Support

Move tourism policy, investment and resource allocation onto an evidence base.

  • National tourism dashboards across agencies
  • Scenario modelling for investment and infrastructure
  • Impact analysis on jobs, receipts and conservation

Outcome · £20M – £15M+ per year

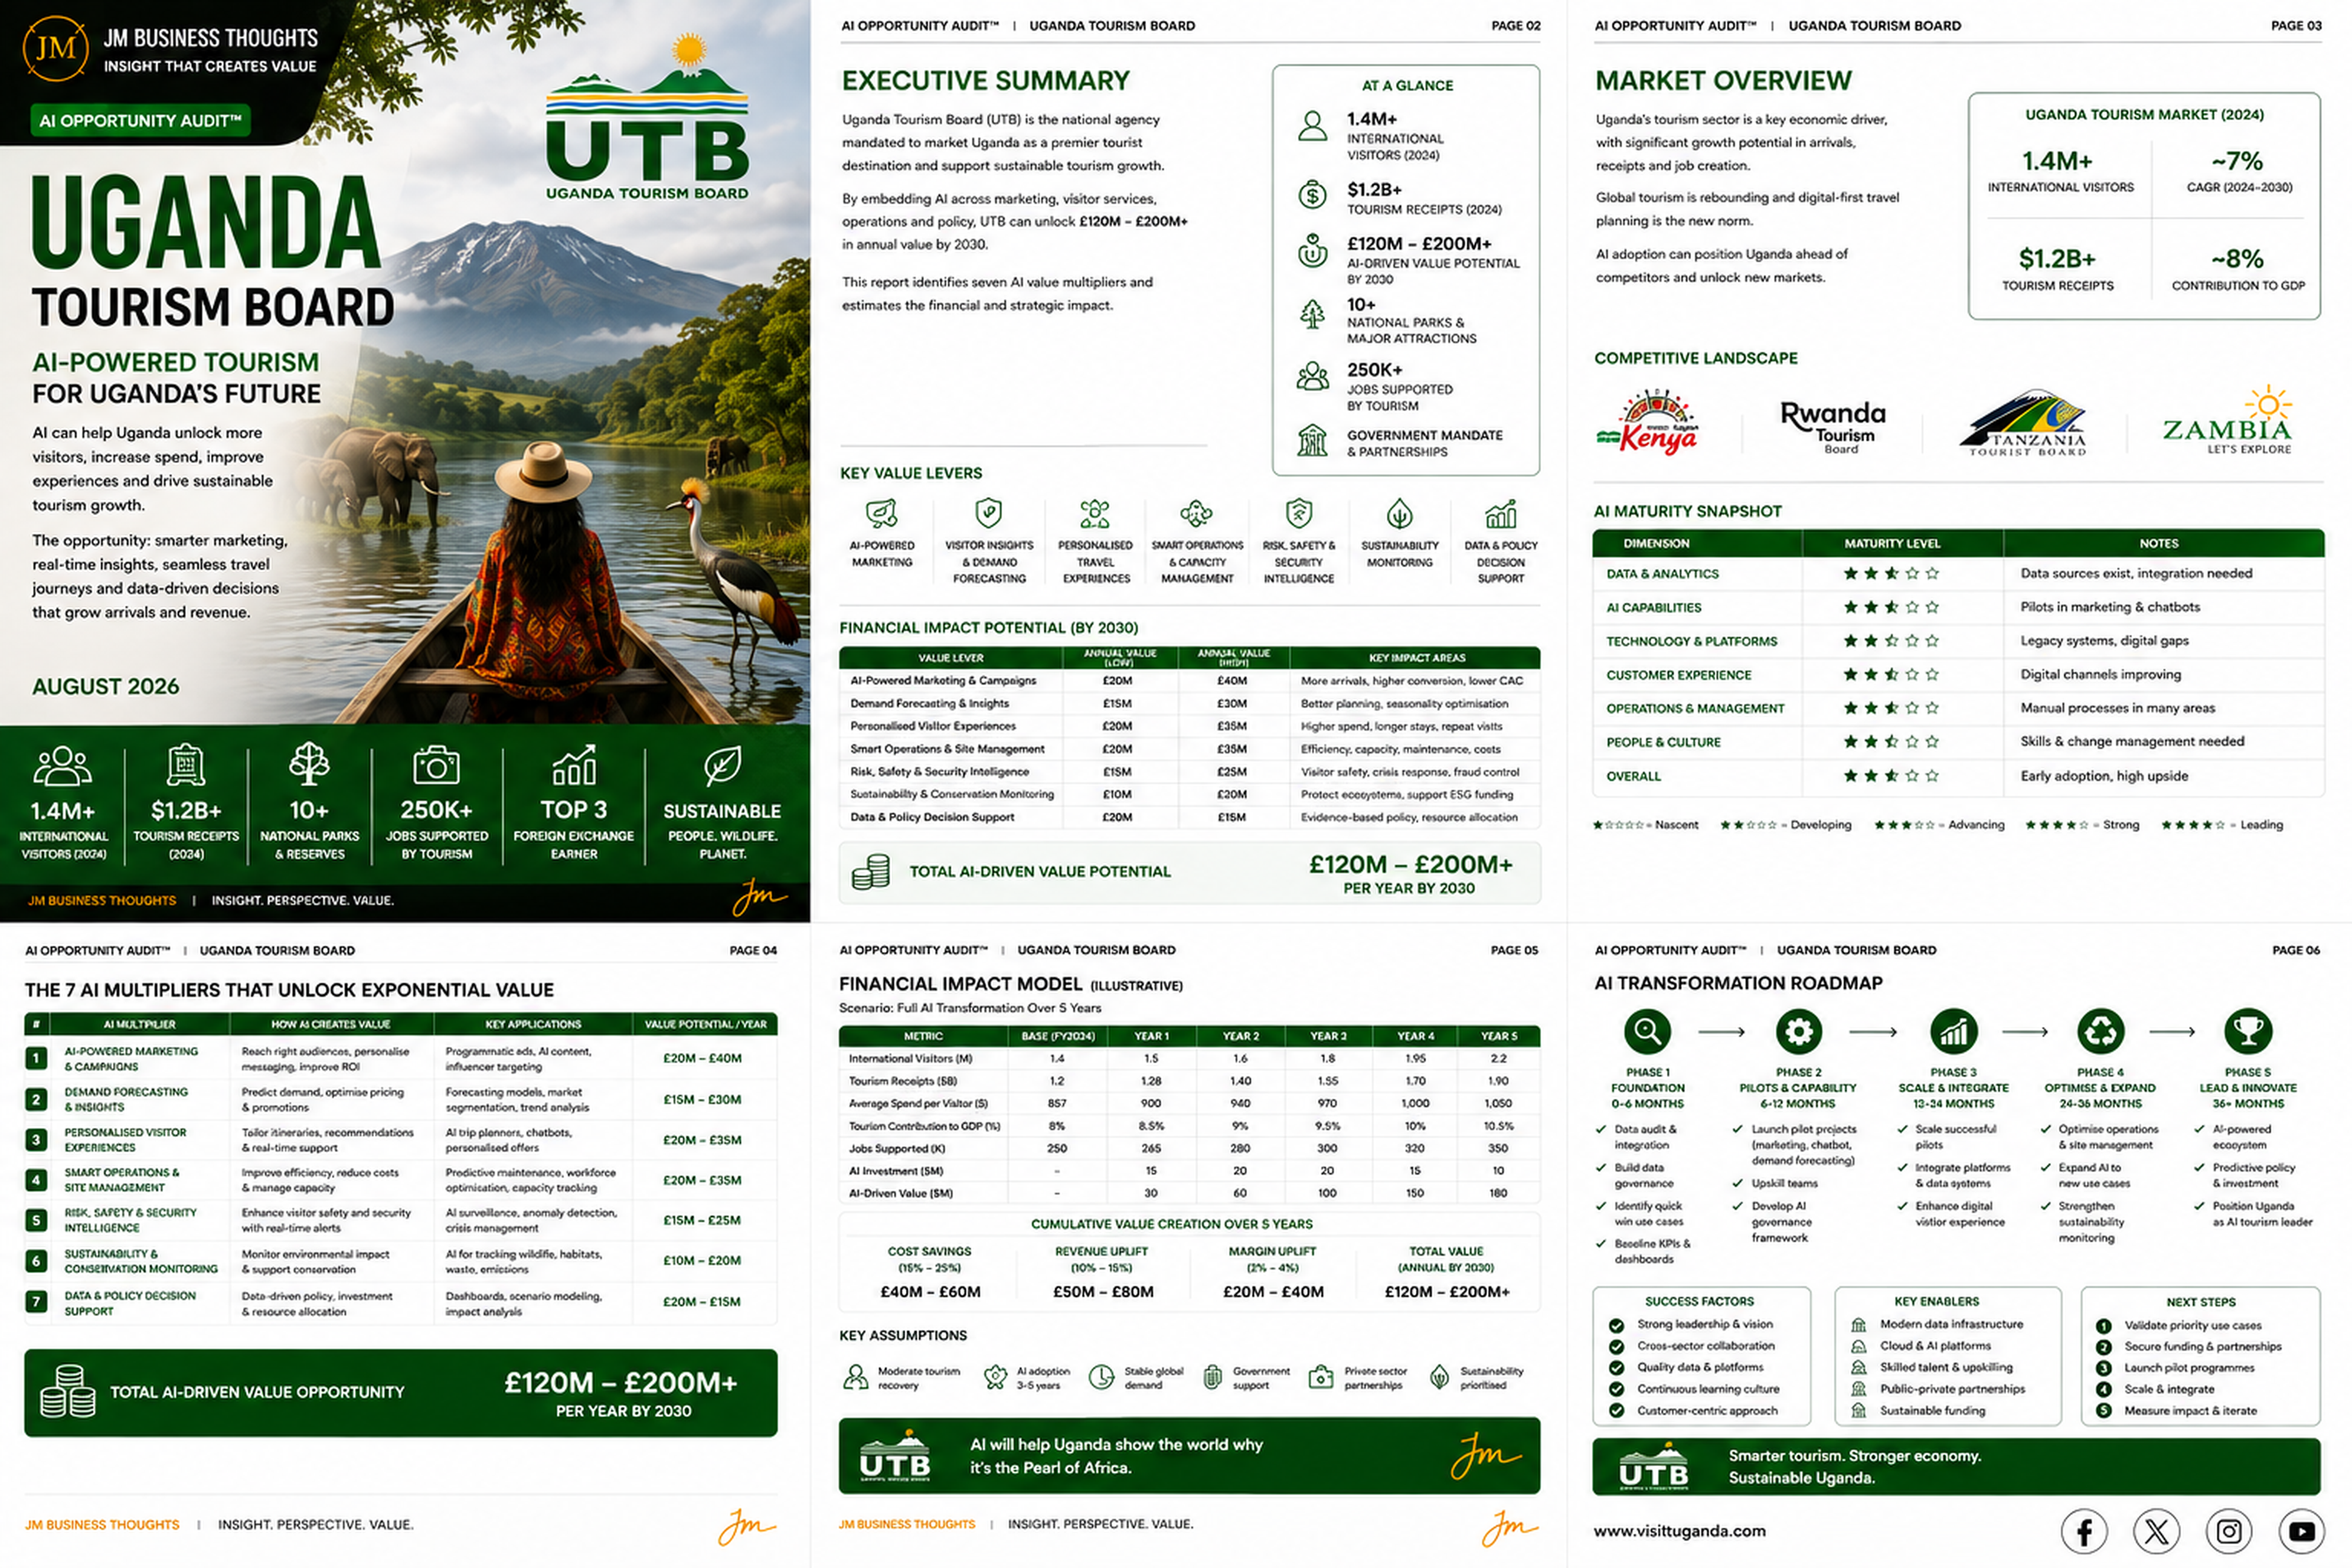
Uganda Tourism Board: AI-Powered Tourism For Uganda's Future. full strategic breakdown
Uganda Tourism Board — AI Opportunity Audit™: executive summary, market overview, AI maturity snapshot, the seven multipliers, five-year financial impact model and transformation roadmap.

The Verdict

Uganda does not have a demand problem — it has an instrumentation problem. Gorillas, the Nile and 10+ national parks already generate $1.2B+ in receipts and ~8% of GDP with almost no predictive infrastructure behind them. UTB's mandate lets it do what no operator can: assemble the shared visitor data layer that turns marketing spend into measured arrivals and arrivals into higher-yield stays. Executed, that is £120M – £200M+ of annual value by 2030, 2.2M visitors, $1.90B in receipts and 350K jobs. The risk is not that AI fails here. It is that Uganda keeps selling a world-class destination with second-hand data while its neighbours buy first-party.

JM founder signature
68 · PureGym — Fitness At Scale. More Personal. More Inclusive.67 · SIXT — Smarter Mobility. Greater Availability. A More Connected Tomorrow.66 · Sendwave — Money That Moves With Intelligence.65 · McDonald’s — Serving The Future With AI.64 · Compare the Market — Smarter Comparison. Better Matches. Brighter Tomorrows.63 · WeBuyAnyCar — Smarter Pricing. Faster Offers. Better Conversion.62 · Primark — Affordable Fashion. Greater Possibilities With AI.61 · Starbucks — Smarter Stores. Stronger Loyalty. Better Margins.60 · IKEA — AI-Powered Home Retail at Global Scale59 · H&M — Smarter Fashion. Brighter Tomorrow.58 · WeWork — The Value Wasn't Lost. It Was Mispriced.57 · Yahoo — The Value Wasn't Lost. It Was Mispriced.56 · Nando's UK — Smarter Restaurants. Stronger Loyalty. Better Margins.55 · The Amplifier54 · The Body Shop53 · Arcadia Group52 · Cazoo51 · Blockbuster50 · Carpetright49 · Wilko48 · Mothercare47 · Phones 4u46 · Farfetch45 · Jumia44 · Toys ‘R’ Us43 · The Collateral Gap — Part One41 · The Amplifier40 · Africa Bee Farming39 · Kenya Airways38 · Africa Greenhouse Farming35 · Biffa (UK)34 · NatWest33 · Skip Hire Companies UK33 · The Audit32 · The Lean Company31 · Africa Mushroom Farming29 · The Rider Economy Nobody Verified28 · The Layer Underneath the Layer27 · Independent Timber Yards & Jewson Timber26 · Link Up TV & GRM Daily25 · East African Portland Cement42 · International Student Credential & Financial Verification — Part One24 · The Supply Chain Inside the Supply Chain23 · The White Space, Mapped22 · The Real Opportunity21 · Greencore20 · West Ham United19 · Roofings Group Uganda18 · Mombasa Port17 · Auto Trader UK16 · Uganda Coffee Development Authority15 · Brookside Dairy14 · GraceKennedy13 · Rightmove12 · Manchester United11 · Greggs30 · Twiga Foods10 · Uchumi09 · Konga08 · Edcon09 · GAME07 · Debenhams06 · Claire's05 · Boohoo04 · Argos