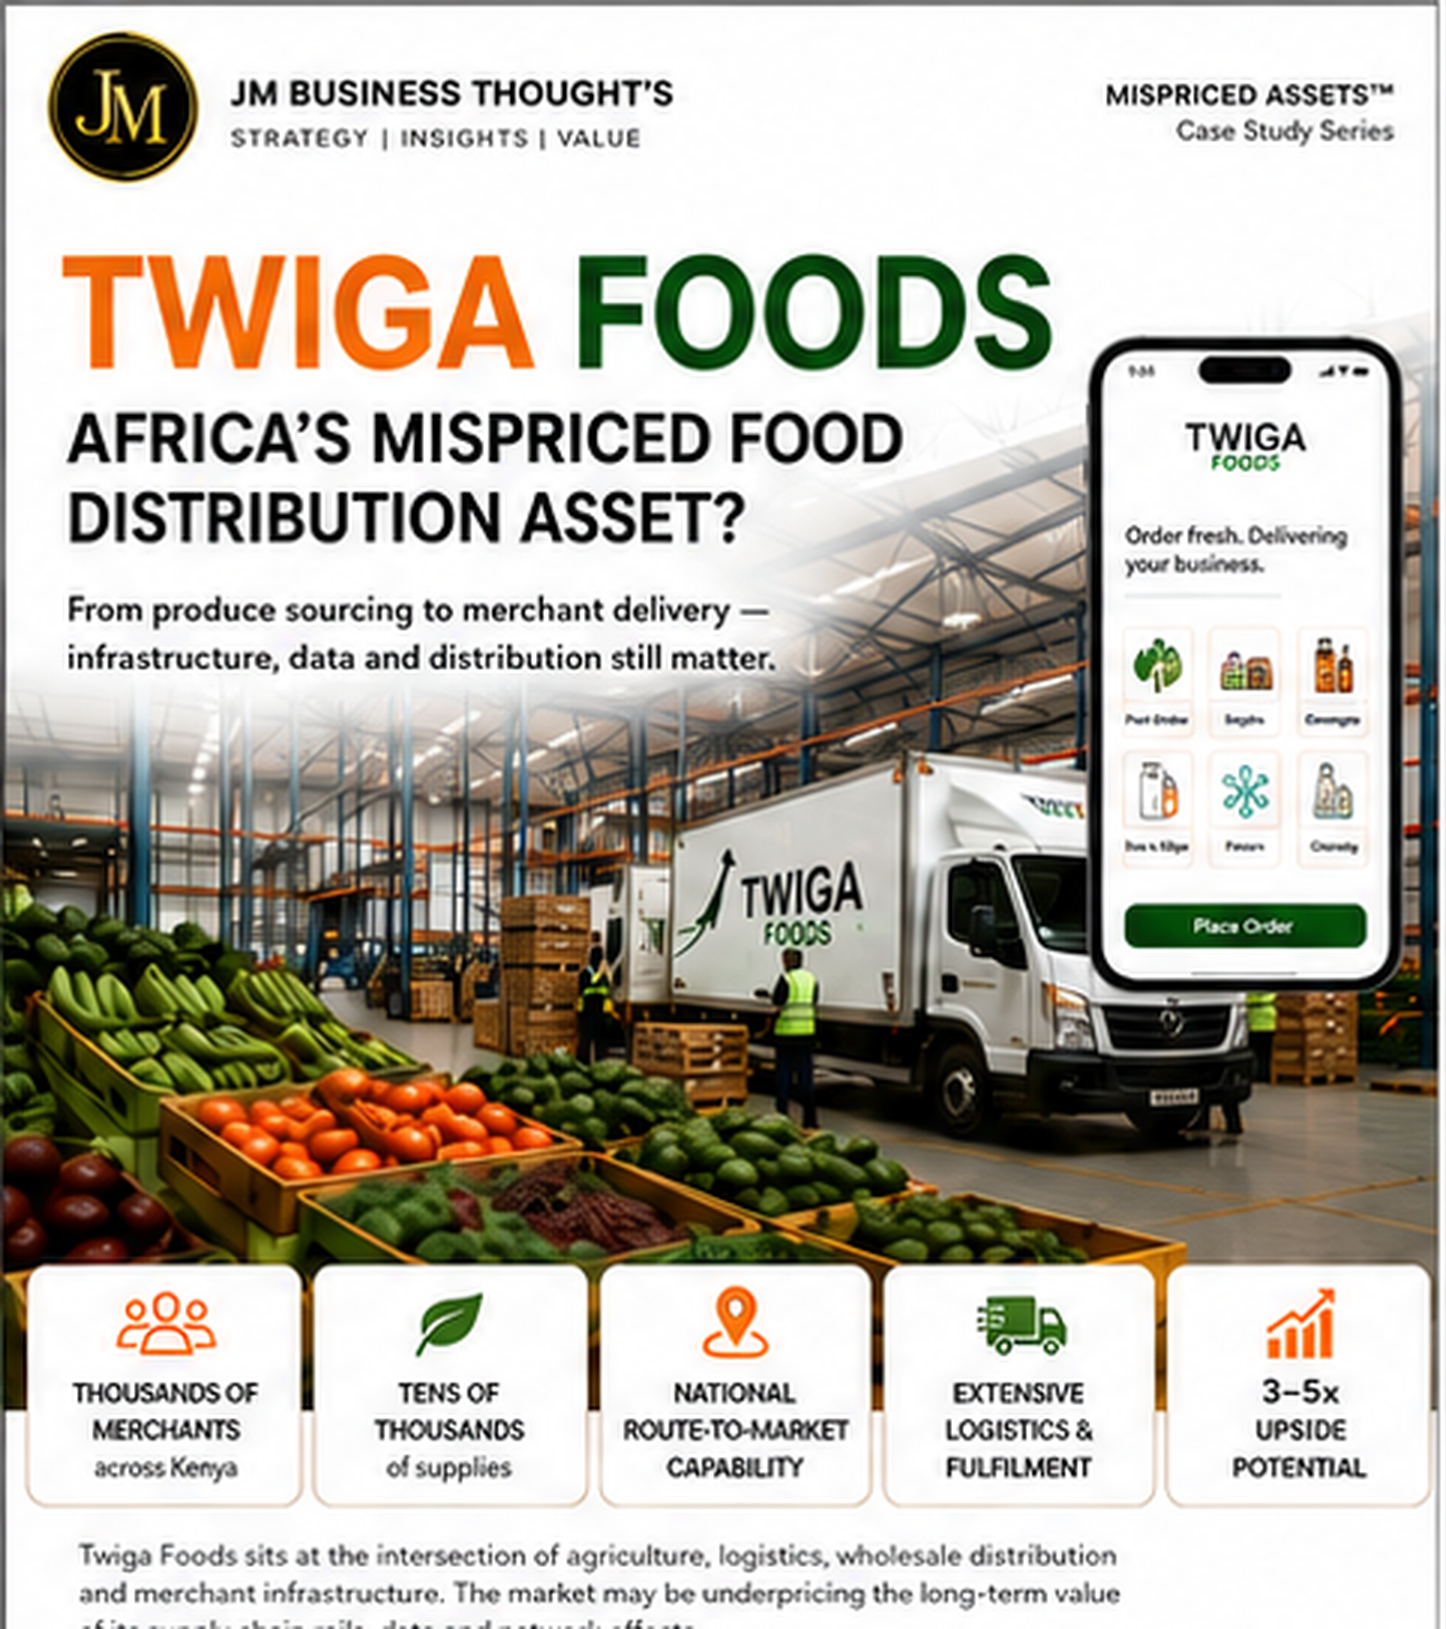
Twiga Foods: Africa's Mispriced Food Distribution Asset? research poster
All Research
30Mispriced Assets™ 13 min readAugust 2026
Coverage · Kenya · AfricaSector · Food Distribution & Supply Chain InfrastructureFormat · Six-page audit

Twiga FoodsAfrica's Mispriced Food Distribution Asset?

From produce sourcing to merchant delivery — infrastructure, data and distribution still matter. Twiga is read as a grocery startup; it is priced as one. The rails underneath tell a different story.

Merchant Base

Thousands

Supplier Network

Tens of Thousands

Route-to-Market

National

Upside Potential

3 – 5X

African Food Market

$1.4TN by 2030

Formal Penetration

~20% Today

Digital Merchants

~2M → 10M+

EBITDA Uplift

15 – 25%

The Thesis

Twiga is infrastructure, not a grocery startup. It connects farmers and suppliers to thousands of merchants through technology-enabled distribution, logistics and fulfilment — the mission-critical rails that keep Africa's food economy moving. Instead of competing on price, Twiga builds defensible moats in data, logistics intelligence, merchant relationships and supply chain orchestration. The market prices the margin of a trading business; the asset is a route-to-market utility.

Exhibit · Report Cover

30 · Mispriced Assets™

Twiga Foods: Africa's Mispriced Food Distribution Asset? report cover
Twiga Foods: Africa's Mispriced Food Distribution Asset?August 2026 · Kenya · Africa
01

The mispricing: a trading multiple on an infrastructure asset

Twiga is read as a low-margin produce trader competing with informal wholesale markets on price. That framing prices the gross margin of the last transaction rather than the replacement cost of the network underneath it — a national sourcing, cold chain, logistics and merchant-servicing capability that took years and hundreds of millions of shillings of operational learning to assemble.

Infrastructure assets are valued on throughput, density and switching cost, not on the spread of a single crate of tomatoes. Once a merchant orders reliably twice a week, the relationship carries credit data, demand signal and assortment control. Those are annuity characteristics sitting inside a business the market still classifies as commodity distribution.

The comparable is not a supermarket chain. It is the toll layer between fragmented supply and fragmented demand: a route-to-market operator that becomes structurally more valuable as formal retail penetration rises from roughly 20% today toward 40% by 2030.

Twiga is infrastructure, not just a grocery startup.
  • Priced on trading spread, not network replacement cost
  • Merchant relationships carry credit, demand and assortment data
  • Density economics improve with every additional drop per route
  • Formalisation of African retail is a structural tailwind, not a bet
02

Market overview: fragmented today, formidable tomorrow

Africa's food distribution remains highly fragmented and informal. Farmers face price volatility with no forward visibility; merchants face unreliable supply, high prices and punishing working capital constraints. Between them sits a chain of intermediaries that adds cost without adding information.

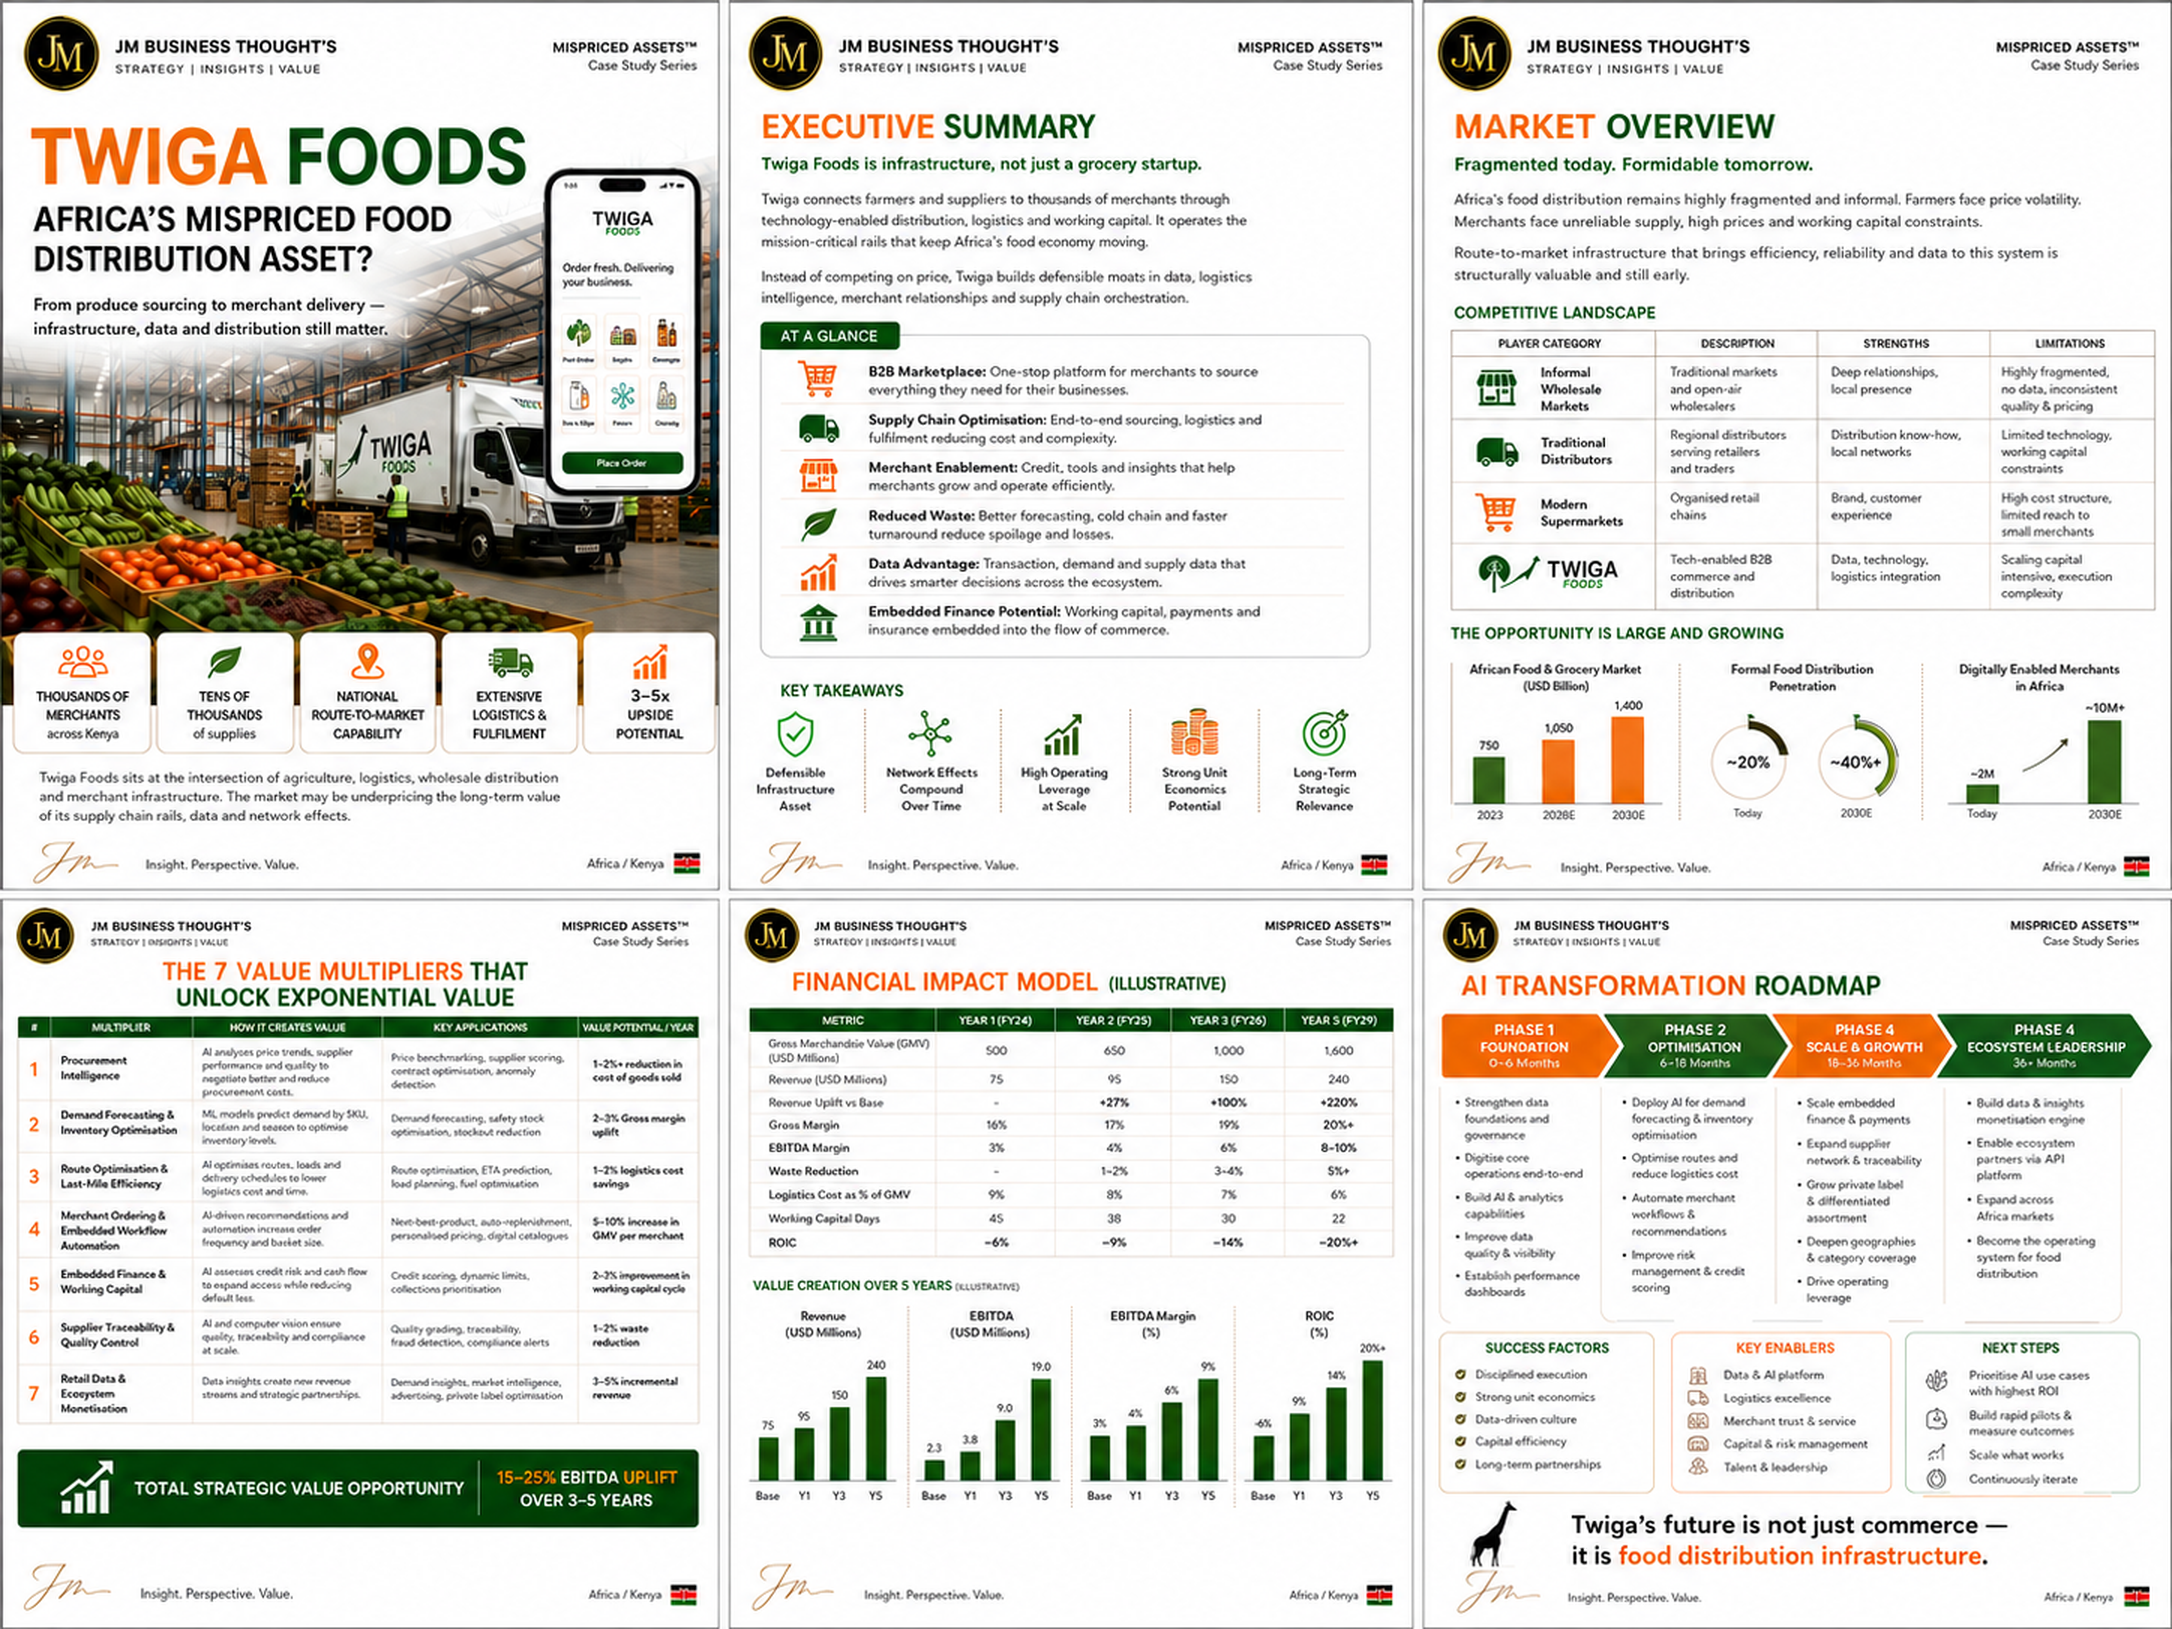
The addressable prize is measured in trillions: the African food and grocery market moves from roughly $750BN in 2023 toward $1.05TN by 2028 and $1.4TN by 2030. Formal food distribution penetration is around 20% today and credibly reaches 40% by 2030, while digitally enabled merchants scale from roughly 2M to more than 10M.

Route-to-market infrastructure that brings efficiency, reliability and data to this system is structurally valuable — and still early. Whoever owns the ordering behaviour of the merchant owns the demand signal for the entire chain behind them.

Fragmented today. Formidable tomorrow.
  • Informal wholesale: deep relationships, no data, inconsistent quality
  • Traditional distributors: local networks, limited technology, working capital constrained
  • Modern supermarkets: brand and experience, high cost, limited reach to small merchants
  • Twiga: tech-enabled B2B commerce with data and logistics integration
03

What the asset actually owns

Five capabilities define the position. A B2B marketplace where merchants source everything they need for their business. Supply chain optimisation that runs end-to-end sourcing, logistics and fulfilment, stripping cost and complexity out of the chain. Merchant enablement through credit, tools and insight that make small businesses more operable.

Then the two that compound: reduced waste — better forecasting, cold chain and faster turnaround cutting spoilage and losses in a category where 20–40% of produce historically never reaches a till — and the data advantage, transaction, demand and supply data that makes every subsequent decision cheaper and more accurate than a competitor's.

Embedded finance sits on top of all of it. Working capital, payments and insurance placed inside the flow of commerce, underwritten by observed ordering behaviour rather than by collateral a merchant does not have.

  • B2B marketplace: one-stop sourcing for the informal and semi-formal merchant
  • Supply chain optimisation: end-to-end sourcing, logistics and fulfilment
  • Merchant enablement: credit, tools and insight that raise merchant survival rates
  • Data advantage: transaction, demand and supply data across the ecosystem
  • Embedded finance: payments, working capital and insurance in the flow of commerce
04

The financial impact model

The illustrative model starts from a base of roughly $500M GMV and $75M revenue at a 16% gross margin, 3% EBITDA margin, 9% logistics cost as a share of GMV, 45 working capital days and a negative 6% ROIC. That is the profile the market is pricing.

Year one lifts GMV to $650M and revenue to $95M — a 27% uplift on base — with gross margin at 17%, EBITDA at 4% and logistics cost down to 8% of GMV. Year three doubles revenue to $150M at 19% gross margin, 6% EBITDA and 30 working capital days. Year five reaches $1.6BN GMV, $240M revenue, 20%+ gross margin, 8–10% EBITDA and 20%+ ROIC.

The mechanism is not price. It is waste reduction of 3–5%, logistics savings of 1–2% of GMV, a 5–10% GMV improvement per merchant through better assortment and replenishment, and a 25-day compression of the working capital cycle. Each is operationally measurable; together they move a negative-ROIC trading business into a 20%+ ROIC infrastructure business.

15–25% EBITDA uplift over three to five years.
05

The competitive moat and the risk case

Five factors make the position defensible: a genuine infrastructure asset rather than a rented one, network effects that compound as supplier and merchant density rise, high operating leverage at scale, strong unit economics potential once route density improves, and long-term strategic relevance to any consumer goods manufacturer that needs distribution into informal retail.

The risk case is honest. Scaling is capital intensive and execution heavy; cold chain and last-mile costs punish subscale density; credit extended to thinly capitalised merchants is a real balance sheet exposure; and price competition from informal wholesalers is permanent. Working capital discipline is the binding constraint, not demand.

The sequencing that fails is expansion before density. Adding geographies before route economics are proven multiplies losses; deepening drops per route before widening the map is the only order that works.

  • Defensible infrastructure asset, not a resold logistics layer
  • Network effects compound with supplier and merchant density
  • High operating leverage once route density crosses breakeven
  • Key risks: capital intensity, credit exposure, informal price competition
06

The transformation roadmap

Phase one, zero to six months: strengthen data foundations and governance, digitise core operations end-to-end, build the AI and analytics capability, improve data quality and visibility, and establish performance dashboards that make unit economics visible per route and per merchant.

Phase two, six to eighteen months: deploy AI for demand forecasting and inventory optimisation, optimise routes and reduce logistics cost, automate merchant workflows and recommendations, and sharpen risk management and credit scoring on observed ordering behaviour.

Phase three, eighteen to thirty-six months: scale embedded finance and payments, expand supplier network and traceability, grow private label and differentiated assortment, deepen geographic and category coverage, and drive operating leverage. Phase four, thirty-six months and beyond: build the data and insights monetisation engine, enable ecosystem partners via an API platform, expand across African markets, and become the operating system for food distribution.
Twiga's future is not just commerce — it is food distribution infrastructure.

The Multiplier Framework

7 compounding levers

Seven value multipliers that unlock exponential value — each mapped to how AI creates the value, the applications that deliver it, and the annual value potential at stake.

01

Procurement Intelligence

1–2% reduction in cost of goods sold

  • Analyse price trends, supplier performance and quality to negotiate better
  • Price benchmarking and supplier scoring
  • Contract optimisation and anomaly detection

Outcome · Buy better before you sell better.

02

Demand Forecasting & Inventory Optimisation

2–3% gross margin uplift

  • ML models predict demand by SKU, location and season to optimise inventory
  • Safety stock optimisation
  • Stockout and spoilage reduction

Outcome · Right product, right depot, right day.

03

Route Optimisation & Last-Mile Efficiency

1–2% logistics cost savings

  • AI optimises routes, loads and delivery schedules
  • ETA prediction and load planning
  • Fuel optimisation across the fleet

Outcome · More drops per route, lower cost per drop.

04

Merchant Ordering & Embedded Workflow Automation

5–10% GMV improvement per merchant

  • AI-driven recommendations and automation increase order frequency and basket size
  • Next-best-product and personalised pricing
  • Digital catalogues and auto-replenishment

Outcome · Every merchant becomes a bigger merchant.

05

Embedded Finance & Working Capital

2–3% improvement in working capital cycle

  • AI assesses credit and cash flow to expand access while reducing default
  • Credit scoring and dynamic limits
  • Collections prioritisation

Outcome · Credit that grows the book, not the loss line.

06

Supplier Traceability & Quality Control

1–2% waste reduction

  • AI and computer vision ensure quality, traceability and compliance at scale
  • Quality grading and fraud detection
  • Compliance alerts across the supplier base

Outcome · Fewer rejections. Fewer write-offs.

07

Retail Data & Ecosystem Monetisation

3–5% incremental revenue

  • Data insights create new revenue streams and strategic partnerships
  • Market intelligence for FMCG manufacturers
  • Advertising and private label optimisation

Outcome · The demand signal becomes the product.

Twiga Foods: Africa's Mispriced Food Distribution Asset? full strategic breakdown
Mispriced Assets™ Case Study: Twiga Foods — the full six-page study covering executive summary, market overview, the seven value multipliers, the five-year financial impact model and the AI transformation roadmap.

The Verdict

Twiga's future is not just commerce — it is food distribution infrastructure. Priced as a trader, it screens expensive. Priced as the route-to-market utility for a $1.4TN food economy formalising in real time, it screens as one of Africa's most mispriced assets — with 15–25% EBITDA uplift and 3–5x strategic upside available to disciplined execution over three to five years.

JM founder signature
68 · PureGym — Fitness At Scale. More Personal. More Inclusive.67 · SIXT — Smarter Mobility. Greater Availability. A More Connected Tomorrow.66 · Sendwave — Money That Moves With Intelligence.65 · McDonald’s — Serving The Future With AI.64 · Compare the Market — Smarter Comparison. Better Matches. Brighter Tomorrows.63 · WeBuyAnyCar — Smarter Pricing. Faster Offers. Better Conversion.62 · Primark — Affordable Fashion. Greater Possibilities With AI.61 · Starbucks — Smarter Stores. Stronger Loyalty. Better Margins.60 · IKEA — AI-Powered Home Retail at Global Scale59 · H&M — Smarter Fashion. Brighter Tomorrow.58 · WeWork — The Value Wasn't Lost. It Was Mispriced.57 · Yahoo — The Value Wasn't Lost. It Was Mispriced.56 · Nando's UK — Smarter Restaurants. Stronger Loyalty. Better Margins.55 · The Amplifier54 · The Body Shop53 · Arcadia Group52 · Cazoo51 · Blockbuster50 · Carpetright49 · Wilko48 · Mothercare47 · Phones 4u46 · Farfetch45 · Jumia44 · Toys ‘R’ Us43 · The Collateral Gap — Part One41 · The Amplifier40 · Africa Bee Farming39 · Kenya Airways38 · Africa Greenhouse Farming37 · Uganda Tourism Board36 · Boots UK35 · Biffa (UK)34 · NatWest33 · Skip Hire Companies UK33 · The Audit32 · The Lean Company31 · Africa Mushroom Farming29 · The Rider Economy Nobody Verified28 · The Layer Underneath the Layer27 · Independent Timber Yards & Jewson Timber26 · Link Up TV & GRM Daily25 · East African Portland Cement42 · International Student Credential & Financial Verification — Part One24 · The Supply Chain Inside the Supply Chain23 · The White Space, Mapped22 · The Real Opportunity21 · Greencore20 · West Ham United19 · Roofings Group Uganda18 · Mombasa Port17 · Auto Trader UK16 · Uganda Coffee Development Authority15 · Brookside Dairy14 · GraceKennedy13 · Rightmove12 · Manchester United11 · Greggs09 · Konga08 · Edcon09 · GAME07 · Debenhams06 · Claire's05 · Boohoo04 · Argos