Starbucks — Smarter Stores. Stronger Loyalty. Better Margins. research poster
All Research

The Hidden AI Operating System Audit Series™

Where AI creates new profit pools—not just productivity.

61AI Opportunity Audit™ 18 min readSeptember 2026
Coverage · Global · Coffeehouse, Loyalty & Digital Ecosystem · Institutional CoverageSector · Coffeehouse Retail, Loyalty & Global GrowthFormat · Six-page audit

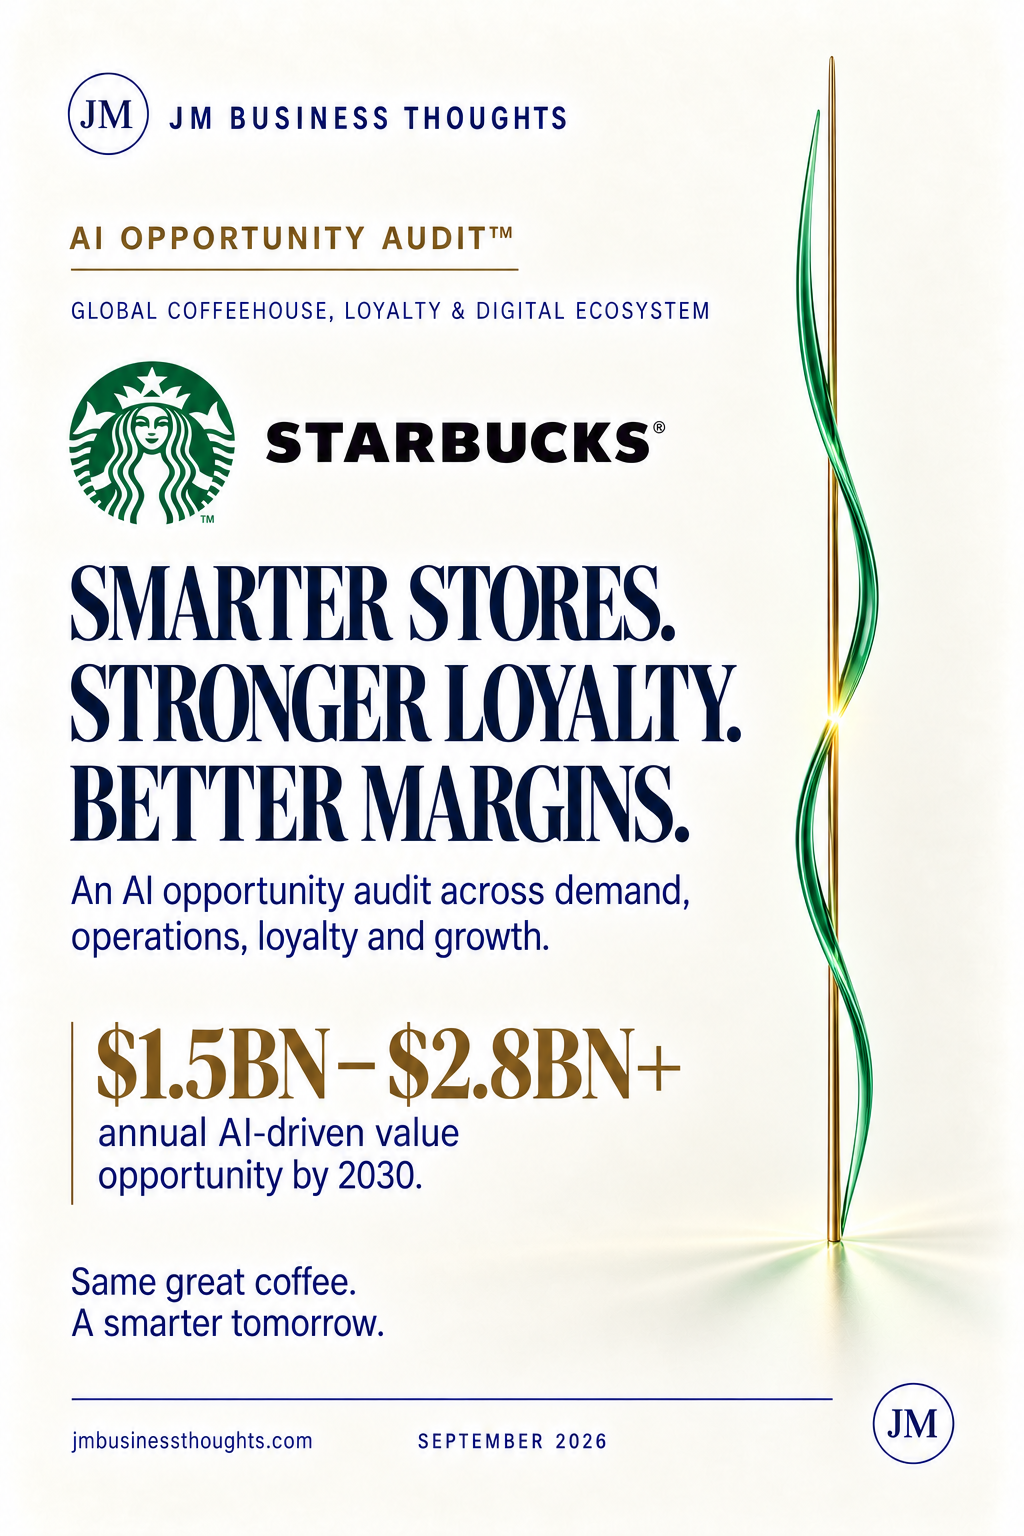
Starbucks — Smarter Stores. Stronger Loyalty. Better Margins.An AI opportunity audit across demand, operations, loyalty and growth.

Starbucks entered FY25 with $37.184bn of net revenues, 40,990 stores globally and 61% of its portfolio in the U.S. and China, running a ‘Back to Starbucks’ strategy that refocuses on coffee, craft and the coffeehouse experience. This audit sizes $1.5BN–$2.8BN+ of illustrative annual AI-driven value by 2030 across seven multipliers — demand forecasting and store planning, personalised rewards and CRM, labour and shift optimisation, order throughput and queue intelligence, inventory and waste, menu and pricing intelligence, and customer and store experience intelligence — without diluting what makes Starbucks a habit rather than a purchase.

Annual AI Value by 2030

$1.5BN – $2.8BN+

Net Revenues (FY25)

$37.184BN

Stores Globally (FY25)

40,990

U.S. + China Share of Portfolio

61%

Branded Coffee Market (2030E)

$213BN

Market CAGR

6.8%

Operating Margin (FY25 → FY30E)

15.4% → 18.0%

Value Multipliers

7

The Thesis

Starbucks' moat is frequency, habit, brand and data — and AI can convert all four into stronger unit economics. This is not a turnaround audit. Starbucks is one of the world's most valuable and recognisable brands, built on coffee, community and a consistent customer experience, with a large global footprint, a powerful digital ecosystem and a highly engaged loyalty base. Those are exactly the preconditions an AI operating system requires: repeat transactions at enormous volume, identified customers, and a store network whose costs move with labour, throughput and waste. The strategic subtlety is that the ‘Back to Starbucks’ strategy — refocusing on coffee, craft and the coffeehouse experience — could read as being in tension with automation. The audit finds the opposite. AI won't replace the Starbucks experience; it can make it more personal, more efficient and more human by removing the operational friction that currently competes with the barista's attention. Same great coffee. A smarter tomorrow.

Exhibit · Report Cover

61 · AI Opportunity Audit™

Starbucks — Smarter Stores. Stronger Loyalty. Better Margins. report cover
Starbucks — Smarter Stores. Stronger Loyalty. Better Margins.September 2026 · Global · Coffeehouse, Loyalty & Digital Ecosystem · Institutional Coverage
01

Executive summary — a global habit, a digital ecosystem, an operating model ready for a smarter layer

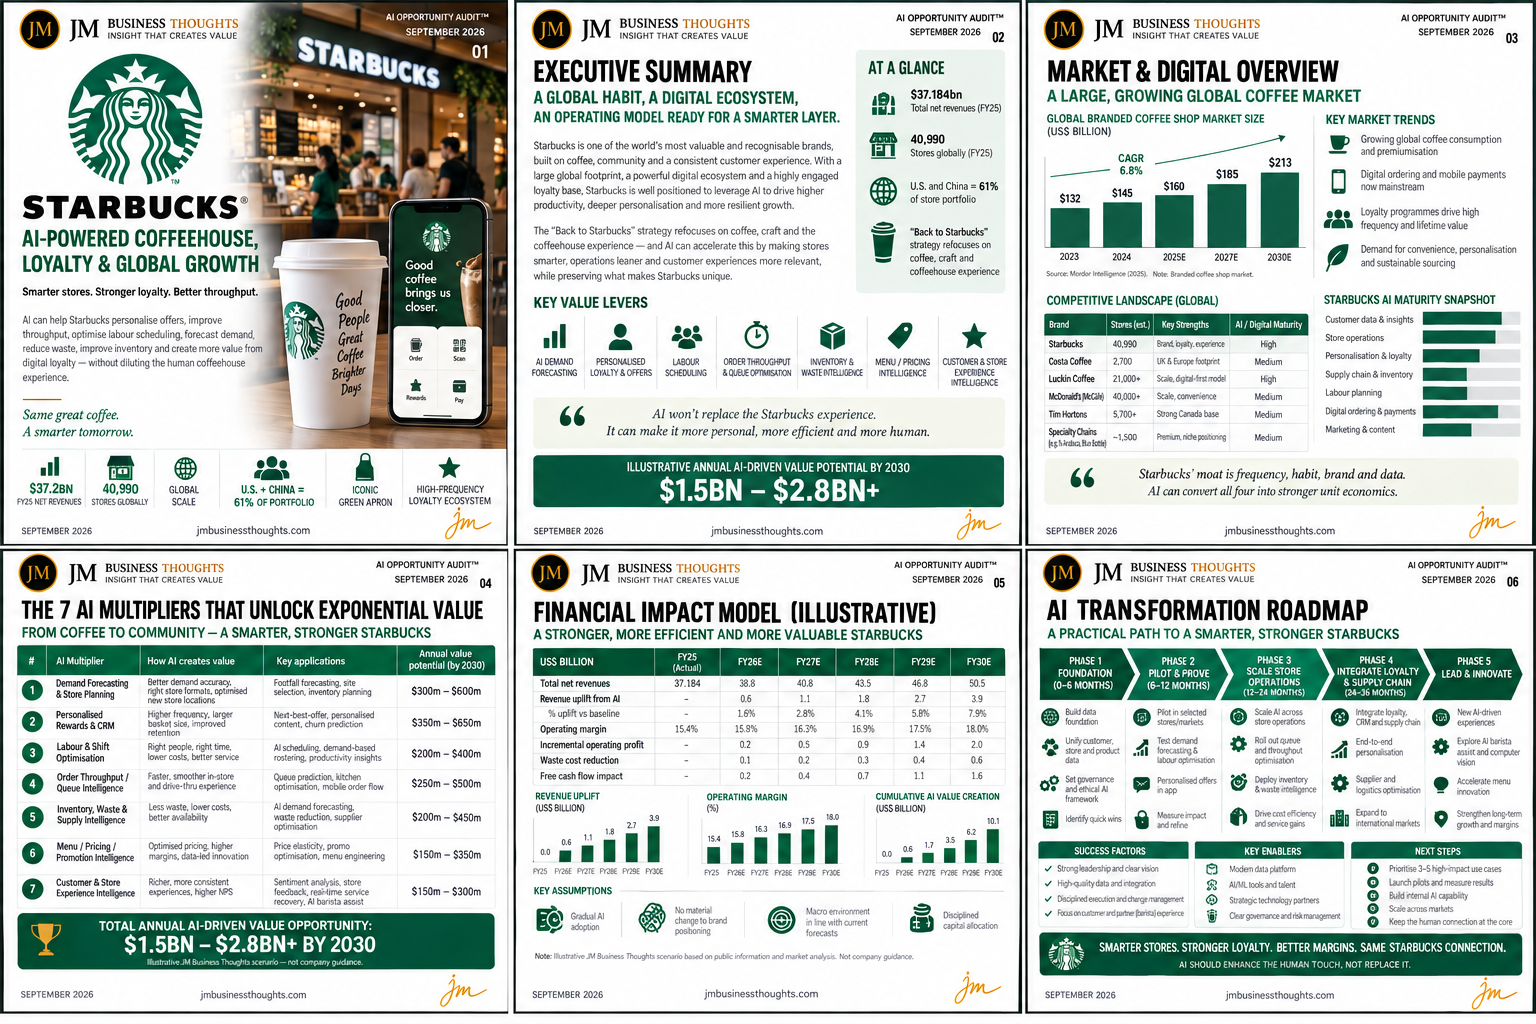
At a glance for FY25: $37.184bn total net revenues, 40,990 stores globally, and 61% of the store portfolio in the U.S. and China — a concentration that makes both markets strategically decisive for any operating-model change.

The 'Back to Starbucks' strategy refocuses the business on coffee, craft and the coffeehouse experience. AI can accelerate that strategy by making stores smarter, operations leaner and customer experiences more relevant, while preserving what makes Starbucks distinctive.

Seven key value levers structure the audit: AI demand forecasting; personalised loyalty and offers; labour scheduling; order throughput and queue optimisation; inventory and waste intelligence; menu and pricing intelligence; and customer and store experience intelligence.

Illustrative annual AI-driven value potential by 2030: $1.5BN–$2.8BN+. The audit's premise is that AI won't replace the Starbucks experience — it can make it more personal, more efficient and more human.

AI won't replace the Starbucks experience. It can make it more personal, more efficient and more human.
  • $37.184bn net revenues · 40,990 stores · 61% U.S. and China (FY25)
  • 'Back to Starbucks' refocuses on coffee, craft and coffeehouse experience
  • Seven levers spanning demand, labour, throughput, loyalty and experience
  • $1.5BN–$2.8BN+ illustrative annual AI-driven value by 2030
02

Market & digital overview — a large, growing global coffee market

The global branded coffee shop market is modelled at $132BN (2023), $145BN (2024), $160BN (2025E), $185BN (2027E) and $213BN (2030E) — a 6.8% CAGR. Growth is structural rather than cyclical.

Four market trends define the environment: growing global coffee consumption and premiumisation; digital ordering and mobile payments now mainstream; loyalty programmes driving high frequency and lifetime value; and demand for convenience, personalisation and sustainable sourcing.

The competitive landscape is more crowded than brand recall suggests. Starbucks (40,990 stores) leads on brand, loyalty and experience with high AI and digital maturity; Luckin Coffee (21,000+) competes on scale and a digital-first model with high maturity; Costa (2,700) holds a UK and Europe footprint; Tim Hortons (5,700+) a strong Canada base; and specialty chains (~1,500) occupy premium niche positioning — each at medium maturity.

Starbucks' AI maturity snapshot is strongest in customer data and insights and store operations, with meaningful headroom in personalisation and loyalty, supply chain and inventory, labour planning, digital ordering and payments, and marketing and content.

Luckin's digital-first model proves the competitive threat is operating-model speed, not brand strength.
  • $132BN (2023) → $213BN (2030E) at 6.8% CAGR
  • Digital ordering and mobile payment are now table stakes, not differentiators
  • Luckin Coffee at 21,000+ stores with high digital maturity
  • Largest AI headroom: personalisation, supply chain, labour planning
03

The operations layer — forecasting, labour and throughput

Demand forecasting and store planning ($300m–$600m) delivers better demand accuracy, right store formats and optimised new store locations through footfall forecasting, site selection and inventory planning. In a 40,990-store network, site and format decisions are among the largest capital commitments the business makes.

Labour and shift optimisation ($200m–$400m) puts the right people in the right place at the right time using AI scheduling, demand-based rostering and productivity insights — the operating lever most directly tied to margin in a service business.

Order throughput and queue intelligence ($250m–$500m) delivers a faster, smoother in-store and drive-thru experience through queue prediction, kitchen optimisation and mobile order flow. Throughput is the constraint that most often converts demand into abandonment at peak.

Inventory, waste and supply intelligence ($200m–$450m) reduces waste and cost while improving availability through AI demand forecasting, waste optimisation and supplier optimisation — closing the loop between the forecast and the physical store.

Throughput is the constraint that most often converts peak demand into abandonment.
  • 01 Demand forecasting & store planning · $300m–$600m
  • 03 Labour & shift optimisation · $200m–$400m
  • 04 Order throughput / queue intelligence · $250m–$500m
  • 05 Inventory, waste & supply intelligence · $200m–$450m
04

The customer layer — rewards, menu and experience intelligence

Personalised rewards and CRM is the single largest lever at $350m–$650m. Higher frequency, larger basket size and improved retention follow from next-best-offer, personalised content and churn prediction applied to an already-identified, highly engaged base. This is the cheapest growth in the model because the audience is owned.

Menu, pricing and promotion intelligence ($150m–$350m) improves margin and enables data-led innovation through price elasticity modelling, promo optimisation and menu engineering — particularly valuable in a business managing premiumisation alongside affordability perception.

Customer and store experience intelligence ($150m–$300m) produces richer, more consistent experiences and higher NPS via sentiment analysis, service feedback, real-time service recovery and AI barista assistance.

The design principle running through all three is restraint: AI should enhance the human touch, not replace it. The experience is the product; the intelligence layer exists to protect the barista's attention, not to substitute for it.

The experience is the product. The intelligence layer exists to protect the barista's attention, not replace it.
  • 02 Personalised rewards & CRM · $350m–$650m — the largest single lever
  • 06 Menu / pricing / promotion intelligence · $150m–$350m
  • 07 Customer & store experience intelligence · $150m–$300m
  • Design principle: AI should enhance the human touch, not replace it
05

Financial impact model (illustrative) — a stronger, more efficient Starbucks

Total net revenues are modelled from $37.184bn (FY25 actual) to $38.8bn (FY26E), $40.8bn (FY27E), $43.5bn (FY28E), $46.8bn (FY29E) and $50.5bn (FY30E), with revenue uplift from AI building at $0.6bn, $1.1bn, $1.8bn, $2.7bn and $3.9bn — 1.6%, 2.8%, 4.1%, 5.8% and 7.9% against baseline.

Operating margin moves from 15.4% (FY25) to 15.8%, 16.3%, 16.9%, 17.5% and 18.0% across the period, producing incremental operating profit of $0.2bn, $0.5bn, $0.9bn, $1.4bn and $2.0bn.

Waste cost reduction contributes $0.1bn, $0.2bn, $0.3bn, $0.4bn and $0.6bn, with free cash flow impact of $0.2bn, $0.4bn, $0.7bn, $1.1bn and $1.6bn. Cumulative AI value creation reaches $10.1bn by FY30E on the illustrative path ($0.6bn, $1.7bn, $3.5bn, $6.2bn, $10.1bn).

Key assumptions: gradual AI adoption; no material change to brand positioning; a macro environment in line with current forecasts; and disciplined capital allocation. Illustrative JM Business Thoughts scenario based on public information and market analysis — not company guidance.

A 260-basis-point operating margin expansion earned through operations, not price.
  • Net revenues $37.184bn (FY25) → $50.5bn (FY30E)
  • Operating margin 15.4% → 18.0%
  • AI revenue uplift reaching 7.9% of baseline by FY30E
  • Cumulative AI value creation $10.1bn by FY30E
06

AI transformation roadmap — five phases, 36+ months

Phase 1, Foundation (0–6 months): build the data foundation, unify customer, store and product data, set governance and an ethical AI framework, and identify quick wins.

Phase 2, Pilot & Prove (6–12 months): pilot in selected stores and markets, test demand forecasting and labour optimisation, run personalised offers in the app, and measure impact and refine.

Phase 3, Scale Store Operations (12–24 months): scale AI across store operations, roll out queue and throughput optimisation, deploy inventory and waste intelligence, and drive cost efficiency and service gains.

Phase 4, Integrate Loyalty & Supply Chain (24–36 months): integrate loyalty, CRM and supply chain, deliver end-to-end personalisation, add supplier and logistics optimisation, and expand to international markets. Phase 5, Lead & Innovate (36+ months): new AI-driven experiences, barista assist and computer vision, accelerated menu innovation, and strengthened long-term growth and margins.

Success factors: strong leadership and clear vision; high-quality data and integration; disciplined execution and change management; and focus on customer and partner (barista) experience. Key enablers: a modern data platform, AI and ML tools and talent, strategic technology partners, and clear governance and risk management.
Prioritise three to five high-impact use cases, pilot and measure, then scale across markets.
  • Phase 1 Foundation · 0–6 months · Phase 2 Pilot & Prove · 6–12 months
  • Phase 3 Scale Store Operations · 12–24 months
  • Phase 4 Integrate Loyalty & Supply Chain · 24–36 months
  • Phase 5 Lead & Innovate · 36+ months
07

Sources and method

Company data: Starbucks FY25 reporting — total net revenues, global store count, U.S. and China portfolio share, and the 'Back to Starbucks' strategic framing.

Market sizing: Mordor Intelligence (2025), branded coffee shop market, 2023–2030E.

Competitive landscape: store counts and positioning for Luckin Coffee, Costa Coffee, Tim Hortons and specialty chains; AI and digital maturity assessments are analyst-assigned and directional.

Method note: each multiplier is sized independently against disclosed revenue and store scale, then netted for overlap before the total annual range is stated. Illustrative JM Business Thoughts scenario — not company guidance.

The Multiplier Framework

7 compounding levers

The seven AI multipliers that unlock exponential value — from coffee to community, a smarter, stronger Starbucks.

01

Demand Forecasting & Store Planning

Better demand accuracy, right store formats · $300m–$600m by 2030.

  • Forecast footfall by site, daypart and season
  • Drive site selection and format choice from predicted, not historic, demand
  • Link store-level inventory planning to the same forecast

Outcome · The network's largest capital decisions are made on evidence rather than precedent.

02

Personalised Rewards & CRM

Higher frequency, larger basket, improved retention · $350m–$650m.

  • Deploy next-best-offer and churn prediction across the loyalty base
  • Personalise app content rather than broadcasting promotions
  • Optimise reward economics instead of discount depth

Outcome · The largest single lever in the model — growth from an audience the business already owns.

03

Labour & Shift Optimisation

Right people, right time, better service · $200m–$400m.

  • Roster against demand-based forecasts, not fixed templates
  • Surface productivity insights to store managers as recommendations
  • Protect peak coverage while removing low-traffic hours

Outcome · Labour cost falls without the service degradation that usually follows it.

04

Order Throughput & Queue Intelligence

Faster, smoother in-store and drive-thru experience · $250m–$500m.

  • Predict queues and sequence kitchen and bar work accordingly
  • Orchestrate mobile order flow against real store capacity
  • Optimise drive-thru staging and order timing

Outcome · Peak demand converts to sales instead of to abandonment.

05

Inventory, Waste & Supply Intelligence

Less waste, lower costs, better availability · $200m–$450m.

  • Forecast perishable demand at item and store level
  • Optimise supplier ordering against predicted consumption
  • Track waste as a live operating metric, not a period report

Outcome · $0.6bn of annual waste cost reduction on the illustrative FY30E path.

06

Menu, Pricing & Promotion Intelligence

Optimised pricing, higher margins, data-led innovation · $150m–$350m.

  • Model price elasticity by market, daypart and product
  • Engineer the menu around margin and throughput together
  • Test innovation with predicted rather than assumed demand

Outcome · Premiumisation is managed against affordability perception rather than against instinct.

07

Customer & Store Experience Intelligence

Richer, more consistent experiences, higher NPS · $150m–$300m.

  • Run sentiment analysis across reviews, app feedback and service contacts
  • Automate real-time service recovery before escalation
  • Deploy AI barista assist to protect craft, not replace it

Outcome · Consistency improves across 40,990 stores while the human connection stays at the core.

Starbucks — Smarter Stores. Stronger Loyalty. Better Margins. full strategic breakdown
Starbucks · AI Opportunity Audit™ — full six-page brief: 01 Cover and FY25 key figures, 02 Executive Summary and key value levers, 03 Market & Digital Overview with competitive landscape and AI maturity snapshot, 04 The 7 AI Multipliers with value ranges, 05 Financial Impact Model FY25–FY30E (illustrative), 06 AI Transformation Roadmap across five phases.

The Verdict

Starbucks does not need to become a technology company; it needs to run the one it already is. A $37.184bn revenue base, 40,990 stores and one of the most engaged loyalty ecosystems in global retail generate every input an AI operating system requires, and they are currently compounding far below their potential. The audit's finding is that the largest lever is not automation but personalisation — $350m–$650m from rewards and CRM against an audience already identified — followed by store planning, throughput and labour. Collectively the illustrative position is $1.5BN–$2.8BN+ annually by 2030, moving operating margin from 15.4% to 18.0% and creating $10.1bn cumulatively. The competitive risk is precise: Luckin's 21,000+ store, digital-first model demonstrates that operating-model speed now competes directly with brand equity. Smarter stores. Stronger loyalty. Better margins. Same Starbucks connection.

JM founder signature
68 · PureGym — Fitness At Scale. More Personal. More Inclusive.67 · SIXT — Smarter Mobility. Greater Availability. A More Connected Tomorrow.66 · Sendwave — Money That Moves With Intelligence.65 · McDonald’s — Serving The Future With AI.64 · Compare the Market — Smarter Comparison. Better Matches. Brighter Tomorrows.63 · WeBuyAnyCar — Smarter Pricing. Faster Offers. Better Conversion.62 · Primark — Affordable Fashion. Greater Possibilities With AI.59 · H&M — Smarter Fashion. Brighter Tomorrow.58 · WeWork — The Value Wasn't Lost. It Was Mispriced.57 · Yahoo — The Value Wasn't Lost. It Was Mispriced.56 · Nando's UK — Smarter Restaurants. Stronger Loyalty. Better Margins.55 · The Amplifier54 · The Body Shop53 · Arcadia Group52 · Cazoo51 · Blockbuster50 · Carpetright49 · Wilko48 · Mothercare47 · Phones 4u46 · Farfetch45 · Jumia44 · Toys ‘R’ Us43 · The Collateral Gap — Part One41 · The Amplifier40 · Africa Bee Farming39 · Kenya Airways38 · Africa Greenhouse Farming37 · Uganda Tourism Board36 · Boots UK35 · Biffa (UK)34 · NatWest33 · Skip Hire Companies UK33 · The Audit32 · The Lean Company31 · Africa Mushroom Farming29 · The Rider Economy Nobody Verified28 · The Layer Underneath the Layer27 · Independent Timber Yards & Jewson Timber26 · Link Up TV & GRM Daily25 · East African Portland Cement42 · International Student Credential & Financial Verification — Part One24 · The Supply Chain Inside the Supply Chain23 · The White Space, Mapped22 · The Real Opportunity21 · Greencore20 · West Ham United19 · Roofings Group Uganda18 · Mombasa Port17 · Auto Trader UK16 · Uganda Coffee Development Authority15 · Brookside Dairy14 · GraceKennedy13 · Rightmove12 · Manchester United11 · Greggs30 · Twiga Foods10 · Uchumi09 · Konga08 · Edcon09 · GAME07 · Debenhams06 · Claire's05 · Boohoo04 · Argos