WeWork — The Value Wasn't Lost. It Was Mispriced. research poster
All Research
58Mispriced Assets™ 18 min readSeptember 2026
Coverage · Global · Flexible Workspace & Real Estate · Institutional CoverageSector · Flexible Workspace, Commercial Real Estate & Hybrid WorkFormat · Six-page audit

WeWork — The Value Wasn't Lost. It Was Mispriced.A global brand. A second chance. A significant upside.

WeWork's collapse was not the failure of a bad idea — it was the result of overexpansion, poor capital discipline and a misaligned business model. The underlying assets remain highly valuable: a globally recognised brand, prime real estate in major cities, a large enterprise customer base and resilient demand for flexible workspace. This study sizes a leaner, post-restructuring WeWork against a $145.4bn flexible workspace market by 2030, modelling revenue of $3.2bn to $7.2bn, adjusted EBITDA from $(0.4)bn to $1.4bn and $5B–$10B+ of illustrative enterprise value potential over three to five years.

Founded

2010 · New York

Locations

~517 · 39 Countries

Peak Memberships

777K+

Chapter 11 Completed

May 2024

Market Size by 2030

$145.4BN

Market CAGR 2024–2030

12.7%

FY2030E Revenue

$7.2BN

Enterprise Value Potential

$5B–$10B+

The Thesis

WeWork is the cleanest test of the Mispriced Assets™ thesis in commercial real estate: the business model failed, the asset base did not. What collapsed in 2019–2023 was a capital structure — long-dated lease liabilities funded against short-dated membership revenue, expanded at a pace no occupancy curve could support. What survived Chapter 11 in May 2024 is materially different: a globally recognised brand with near-universal awareness in its category, prime locations across major global cities on renegotiated economics, a large enterprise customer base with recurring multi-desk contracts, and demand conditions that are structurally stronger than they were at the peak. The market prices WeWork against the memory of the old lease book. It gives no credit for the fact that hybrid work is now the default operating model for corporate occupiers, that the global flexible workspace market is projected to reach $145.4bn by 2030 at a 12.7% CAGR, or that the emerging entity operates a fundamentally leaner cost base. On an illustrative model, disciplined focus on core profitable markets, occupancy recovery and mix shift toward enterprise take revenue from $3.2bn to $7.2bn, gross margin from 25% to 39%, and adjusted EBITDA from $(0.4)bn to $1.4bn by FY2030E — supporting $5B–$10B+ of enterprise value potential. The value wasn't lost. It was mispriced.

Exhibit · Report Cover

58 · Mispriced Assets™

WeWork — The Value Wasn't Lost. It Was Mispriced. report cover
WeWork — The Value Wasn't Lost. It Was Mispriced.September 2026 · Global · Flexible Workspace & Real Estate · Institutional Coverage
01

Executive summary — a global platform with enduring value

WeWork's collapse was not the failure of a bad idea — it was the result of overexpansion, poor capital discipline and a misaligned business model that funded long-dated lease obligations with short-dated membership revenue.

The underlying assets, however, remain highly valuable: a globally recognised brand, prime real estate in major global cities, a large enterprise customer base and resilient structural demand for flexible workspace.

With a leaner structure and sharper execution, WeWork has the potential to create significant shareholder value in the years ahead. Chapter 11 restructuring completed in May 2024, materially resetting the lease book and cost base.

The emerging entity is a focused operator concentrated on core profitable markets, with significant upside available through occupancy, profitability and asset optimisation rather than through further expansion.

WeWork's real value isn't in what it was — but in what it can become, with the right discipline.
  • Founded 2010, New York · ~517 locations across 39 countries
  • 777K+ memberships at pre-restructuring peak
  • Chapter 11 restructuring completed May 2024
  • Iconic global brand with high awareness and prime locations at attractive economics
02

Market overview — a growing, resilient flexible workspace market

The global flexible workspace market is projected to reach $145.4bn by 2030, growing at a 12.7% CAGR from 2024, driven by hybrid work, SME growth and corporate demand for flexible real estate solutions.

The trajectory is consistent rather than speculative: $66.8bn (2024), $75.3bn (2025), $85.0bn (2026), $108.5bn (2028) and $145.4bn (2030).

Demand drivers are structural, not cyclical: hybrid and flexible work models, SME and start-up formation, cost efficiency versus traditional long leases, enterprise demand for scalable space, and the continuing rise of global talent and remote work.

The competitive landscape includes IWG/International Workplace Group, Regus, Spaces, Industrious, Knotel, Flexoffice and Convene. Within that set, WeWork retains the strongest single consumer-facing brand — the differentiator most expensive for a competitor to replicate.

Flexible work isn't a trend. It's a structural shift — and WeWork remains one of the few global brands built for a multi-location, multi-industry world.
  • $145.4BN global flexible workspace market by 2030 · 12.7% CAGR (2024–2030)
  • $66.8BN (2024) → $85.0BN (2026) → $108.5BN (2028) → $145.4BN (2030)
  • Drivers: hybrid work, SME growth, cost efficiency vs. traditional leases, enterprise scalability
  • WeWork differentiators: iconic brand, prime locations, enterprise base, community and network effects
03

The mispricing — a capital structure failed, not an asset base

Mispricing in real estate operating businesses usually comes from conflating the vehicle with the asset. WeWork's pre-2023 vehicle was structurally unsound: fixed, long-duration lease liabilities funded by cancellable, short-duration membership income, scaled aggressively into markets that could not reach breakeven occupancy.

Restructuring addressed exactly that mismatch. Rejected and renegotiated leases, exited non-core geographies and a reset cost base mean the post-2024 entity carries a different liability profile against a similar quality of location.

The assets the market cannot rebuild remain intact: brand recognition in a category where most competitors are unbranded, prime addresses in major cities, and enterprise relationships that produce recurring, multi-desk, multi-year revenue with far lower churn than individual memberships.

The correction mechanism is operational proof, not narrative repair: demonstrated occupancy recovery, positive unit economics per location, and clean segment disclosure separating mature profitable estate from stabilising estate.

The same assets that once fuelled overexpansion can, with discipline, fuel a stronger, more profitable WeWork.
  • Failure was capital structure and pace, not product-market fit
  • Chapter 11 (completed May 2024) reset the lease book and geographic footprint
  • Brand, prime locations and enterprise relationships survived the restructuring intact
  • Re-rating follows unit economics and occupancy disclosure, not repositioning language
04

Seven value multipliers — multiple pathways to rebuild value

WeWork's core assets create multiple independent levers for long-term value creation: the real estate portfolio, brand and community, enterprise relationships, operational efficiency, expansion optionality, technology and data, and capital and partnership structure.

The real estate portfolio delivers prime locations in global cities at attractive long-term economics post-renegotiation. Brand and community sustain global recognition and a loyal member base that reduces acquisition cost.

Enterprise relationships are the highest-quality revenue in the model: large corporate clients provide recurring, high-value, multi-desk contracts with materially better retention than individual memberships. Operational efficiency converts a leaner cost base into profitable unit economics per location.

Expansion opportunities are targeted rather than universal — underserved markets and adjacent services such as flexible residences and events. Technology and data turn space utilisation, member behaviour and workplace insight into higher-margin advisory and optimisation products.

Multiple pathways to rebuild and create value — each independently defensible, collectively compounding.
  • 01 Real Estate Portfolio · 02 Brand & Community · 03 Enterprise Relationships
  • 04 Operational Efficiency · 05 Expansion Opportunities
  • 06 Technology & Data · 07 Capital Discipline & Partnerships
  • Growth is targeted at profitable density, not footprint expansion
05

Financial impact model — a leaner, more profitable WeWork

Illustrative model, US$ billion: revenue moves from 3.2 (2024A, post-restructure) to 3.8 (2025E), 5.1 (2027E) and 7.2 (2030E).

Gross profit rises from 0.8 to 1.1, 1.8 and 2.8, with gross margin improving from 25% to 29%, 35% and 39% as occupancy recovers and mix shifts toward higher-yield enterprise contracts.

Adjusted EBITDA moves from $(0.4)bn at a (12%) margin to 0.1 (3%), 0.6 (12%) and 1.4 (19%) — the crossing point into sustained profitability occurring on operating leverage rather than on new location openings.

Free cash flow strengthens from $(0.8)bn to $(0.2)bn, then 0.4 and 1.1 by 2030E, supporting $5B–$10B+ of illustrative enterprise value potential over three to five years, driven by higher occupancy and membership growth, improving margins through operational discipline, and optionality from asset optimisation and strategic partnerships.

$5B–$10B+ illustrative enterprise value potential over 3–5 years — on discipline, not expansion.
  • Revenue $3.2bn → $7.2bn (2024A → 2030E)
  • Gross margin 25% → 39%
  • Adjusted EBITDA $(0.4)bn (–12%) → $1.4bn (19%)
  • Free cash flow $(0.8)bn → $1.1bn
06

Transformation roadmap — stabilise, optimise, scale

Phase 1 · Stabilise (0–12 months): focus on core and profitable locations, improve occupancy and revenue per location, streamline costs and simplify operations, and rebuild customer trust and brand momentum.

Phase 2 · Optimise (12–24 months): expand high-performing locations, launch enhanced member experience and digital tools, grow the enterprise and SME segment, and explore adjacent services including flexible residences and events.

Phase 3 · Scale (24–36 months): scale globally in key cities and regions, leverage data and insight for higher margins, pursue strategic partnerships and capital opportunities, and position for long-term market leadership.

The sequencing is the thesis. Occupancy and cost discipline in Phase 1 buy the credibility required for selective growth in Phase 2; the multiple re-rates in Phase 3 on demonstrated margin, not on announced expansion.

A leaner WeWork can still be a global leader. The foundation is there — now it's about execution.
  • Phase 1 Stabilise · 0–12 months
  • Phase 2 Optimise · 12–24 months
  • Phase 3 Scale · 24–36 months
  • Each phase is gated on unit-economics proof, not calendar
07

Sources and method

Market sizing: global flexible workspace market size and 12.7% CAGR (2024–2030) per published industry market research; competitive landscape from public company disclosures for IWG, Regus, Spaces, Industrious, Knotel, Flexoffice and Convene.

Company position: WeWork public filings and restructuring disclosures, including Chapter 11 completion in May 2024, location count (~517 across 39 countries) and pre-restructuring membership peak (777K+).

Financial model: illustrative JM Business Thoughts scenario based on market data and analysis, showing potential value creation from occupancy recovery, mix shift and operational discipline. Figures are illustrative, not forecast, and are not company guidance.

Method note: each multiplier is sized against the post-restructuring revenue base and netted for overlap before the aggregate margin path is stated.

The Multiplier Framework

7 compounding levers

Seven levers that convert a restructured asset base into a durable, higher-margin flexible workspace platform.

01

Real Estate Portfolio

Prime locations in global cities at attractive long-term value.

  • Retain and densify the mature, profitable estate in core cities
  • Convert renegotiated lease economics into per-location margin
  • Exit or restructure any location that cannot reach target occupancy

Outcome · The portfolio is priced on unit economics rather than on legacy lease liabilities.

02

Brand & Community

Global brand recognition and a loyal member base.

  • Use category-leading awareness to lower member acquisition cost
  • Rebuild trust through service consistency, not marketing spend
  • Monetise community and network effects competitors cannot replicate

Outcome · The strongest consumer brand in an unbranded category becomes a measurable cost advantage.

03

Enterprise Relationships

Large corporate clients provide recurring, high-value revenue opportunities.

  • Shift mix toward multi-desk, multi-year corporate contracts
  • Build managed-workspace and headquarters-as-a-service offerings
  • Price on portfolio flexibility, which traditional landlords cannot match

Outcome · Revenue quality improves: longer duration, lower churn, higher contribution per desk.

04

Operational Efficiency

A leaner cost base, discipline and profitable unit economics.

  • Standardise fit-out, staffing and service delivery across the estate
  • Manage to contribution margin per location, reported monthly
  • Automate member operations and building services with AI tooling

Outcome · The crossing into positive EBITDA comes from operating leverage, not new openings.

05

Expansion Opportunities

Targeted growth in underserved markets and adjacent services.

  • Open only where pre-committed enterprise demand underwrites the space
  • Test flexible residences, events and hybrid meeting products
  • Use asset-light management and franchise structures over new leases

Outcome · Growth resumes without reintroducing the liability mismatch that caused the collapse.

06

Technology & Data

Space utilisation, member data and workplace insight driving higher margins.

  • Instrument utilisation across the estate and price dynamically
  • Sell workplace analytics and portfolio optimisation to enterprise clients
  • Use demand data to guide pricing, staffing and expansion decisions

Outcome · A real estate operator gains a software-margin revenue line and a pricing edge.

07

Capital Discipline & Partnerships

Make the balance sheet the strategy, not the constraint.

  • Pursue landlord revenue-share and management agreements over fixed leases
  • Disclose mature versus stabilising estate separately for the market
  • Partner with capital providers on asset optimisation rather than raising to expand

Outcome · The structural flaw that destroyed the first WeWork becomes the governing discipline of the second.

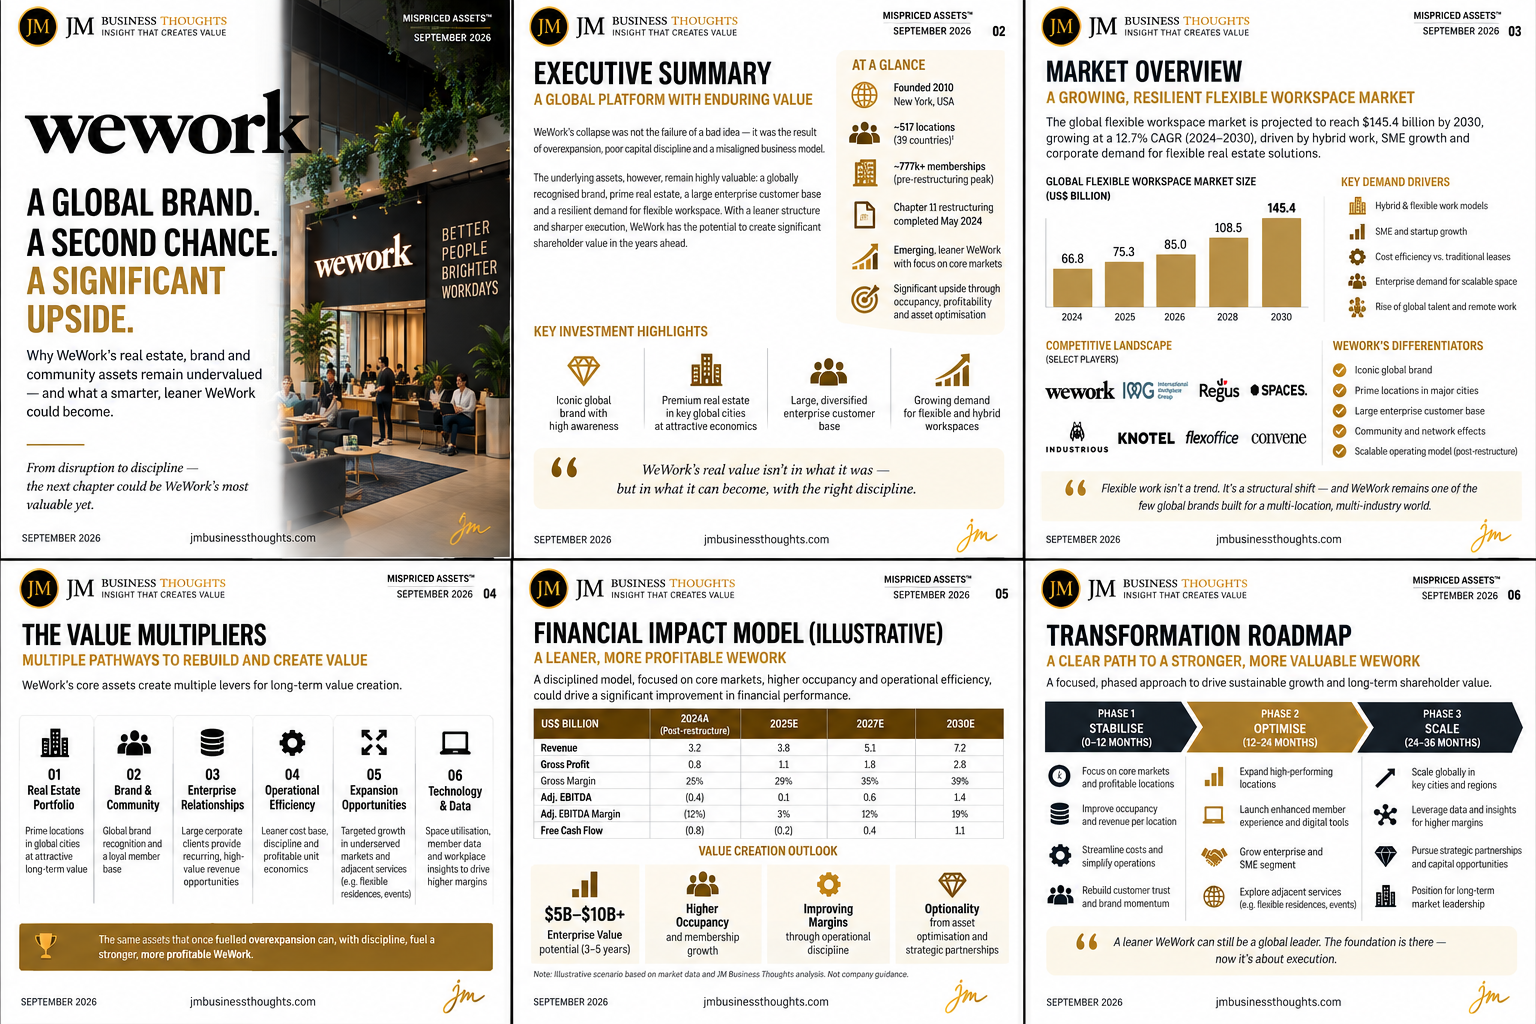
WeWork — The Value Wasn't Lost. It Was Mispriced. full strategic breakdown
WeWork · Mispriced Assets™ — full six-page brief: 01 Cover, 02 Executive Summary and key investment highlights, 03 Market Overview with the $145.4BN 2030 flexible workspace projection and competitive landscape, 04 The Value Multipliers, 05 Financial Impact Model 2024A–2030E, 06 Transformation Roadmap.

The Verdict

WeWork was never a bad idea priced correctly; it was a good idea financed incorrectly. The restructuring removed the specific defect — long-dated lease liabilities funded by short-dated membership revenue — while leaving the assets that made the idea work in the first place: an iconic global brand, prime addresses in major cities, a large enterprise base and a demand environment now structurally stronger than at the peak, with the flexible workspace market on a path to $145.4bn by 2030. On an illustrative basis, occupancy recovery, enterprise mix shift and operational discipline take revenue from $3.2bn to $7.2bn, gross margin from 25% to 39% and adjusted EBITDA from $(0.4)bn to $1.4bn by 2030E, supporting $5B–$10B+ of enterprise value potential over three to five years. A leaner WeWork can still be a global leader. The foundation is there — now it is about execution. The value wasn't lost. It was mispriced.

JM founder signature
68 · PureGym — Fitness At Scale. More Personal. More Inclusive.67 · SIXT — Smarter Mobility. Greater Availability. A More Connected Tomorrow.66 · Sendwave — Money That Moves With Intelligence.65 · McDonald’s — Serving The Future With AI.64 · Compare the Market — Smarter Comparison. Better Matches. Brighter Tomorrows.63 · WeBuyAnyCar — Smarter Pricing. Faster Offers. Better Conversion.62 · Primark — Affordable Fashion. Greater Possibilities With AI.61 · Starbucks — Smarter Stores. Stronger Loyalty. Better Margins.60 · IKEA — AI-Powered Home Retail at Global Scale59 · H&M — Smarter Fashion. Brighter Tomorrow.56 · Nando's UK — Smarter Restaurants. Stronger Loyalty. Better Margins.55 · The Amplifier54 · The Body Shop53 · Arcadia Group52 · Cazoo51 · Blockbuster50 · Carpetright49 · Wilko48 · Mothercare47 · Phones 4u46 · Farfetch45 · Jumia44 · Toys ‘R’ Us43 · The Collateral Gap — Part One41 · The Amplifier40 · Africa Bee Farming39 · Kenya Airways38 · Africa Greenhouse Farming37 · Uganda Tourism Board36 · Boots UK35 · Biffa (UK)34 · NatWest33 · Skip Hire Companies UK33 · The Audit32 · The Lean Company31 · Africa Mushroom Farming29 · The Rider Economy Nobody Verified28 · The Layer Underneath the Layer27 · Independent Timber Yards & Jewson Timber26 · Link Up TV & GRM Daily25 · East African Portland Cement42 · International Student Credential & Financial Verification — Part One24 · The Supply Chain Inside the Supply Chain23 · The White Space, Mapped22 · The Real Opportunity21 · Greencore20 · West Ham United19 · Roofings Group Uganda18 · Mombasa Port17 · Auto Trader UK16 · Uganda Coffee Development Authority15 · Brookside Dairy14 · GraceKennedy13 · Rightmove12 · Manchester United11 · Greggs30 · Twiga Foods10 · Uchumi09 · Konga08 · Edcon09 · GAME07 · Debenhams06 · Claire's05 · Boohoo04 · Argos