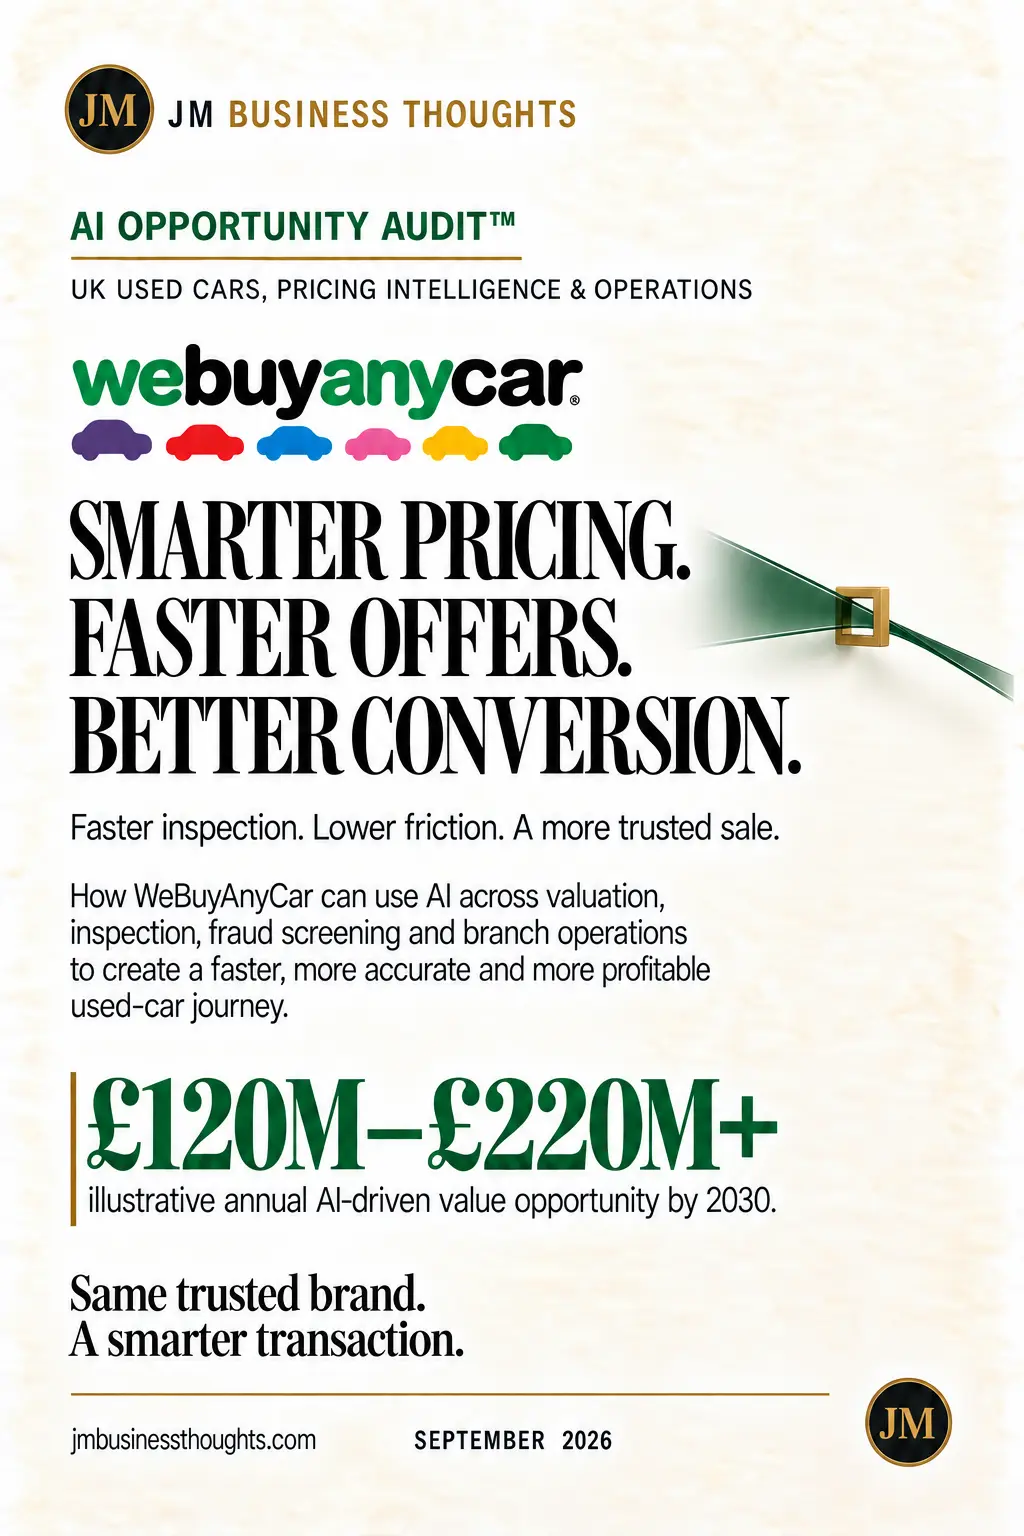
Compare the Market — Smarter Comparison. Better Matches. Brighter Tomorrows. research poster
All Research

The Hidden AI Operating System Audit Series™

Where AI creates new profit pools—not just productivity.

64AI Opportunity Audit™ 17 min readSeptember 2026
Coverage · United Kingdom · 40M+ Adults Comparing Online · Institutional CoverageSector · UK Comparison, Customer Journeys & Digital GrowthFormat · Six-page audit

Compare the Market — Smarter Comparison. Better Matches. Brighter Tomorrows.More relevant choices. Simpler journeys. Stronger customer value.

Comparethemarket is the UK's most recognised price comparison brand, operating in a £65BN+ general insurance market where 40M+ adults compare financial products online and 70%+ of policies are now researched digitally. This audit sizes £50M–£100M+ of illustrative annual incremental revenue across seven multipliers spanning search and recommendation, switching journeys, segmentation, conversion, fraud and verification, marketing efficiency, call-centre automation and partner intelligence — with 20–30% operational cost savings and 2–3x ROI within three years.

Incremental Annual Revenue

£50M – £100M+

UK General Insurance Market

£65BN+

UK Adults Comparing Online

40M+

Policies Researched Online

70%+

Higher Conversion Rate

+10–20%

Operational Cost Savings

20–30%

ROI Within Three Years

2–3x

Value Multipliers

7

The Thesis

Comparethemarket has transformed the way the UK shops for insurance and household services. Its assets are unusually well suited to an AI operating layer: high brand trust and awareness, a multi-product platform spanning insurance, energy, broadband and mobile, a large and loyal customer base, an established partner insurer network, and data-rich customer journeys. The strategic question is no longer whether people compare online — 70%+ of policies are already researched digitally — but whether the comparison itself is intelligent. Today a comparison is a ranked list; tomorrow it is a recommendation that understands the household, predicts the right moment to switch, and prices risk and fraud before a quote is served. AI offers the next step change: a more personal, predictive and seamless experience that drives higher conversion, stronger customer loyalty and deeper partner value. Same people. A brighter tomorrow.

Exhibit · Report Cover

64 · AI Opportunity Audit™

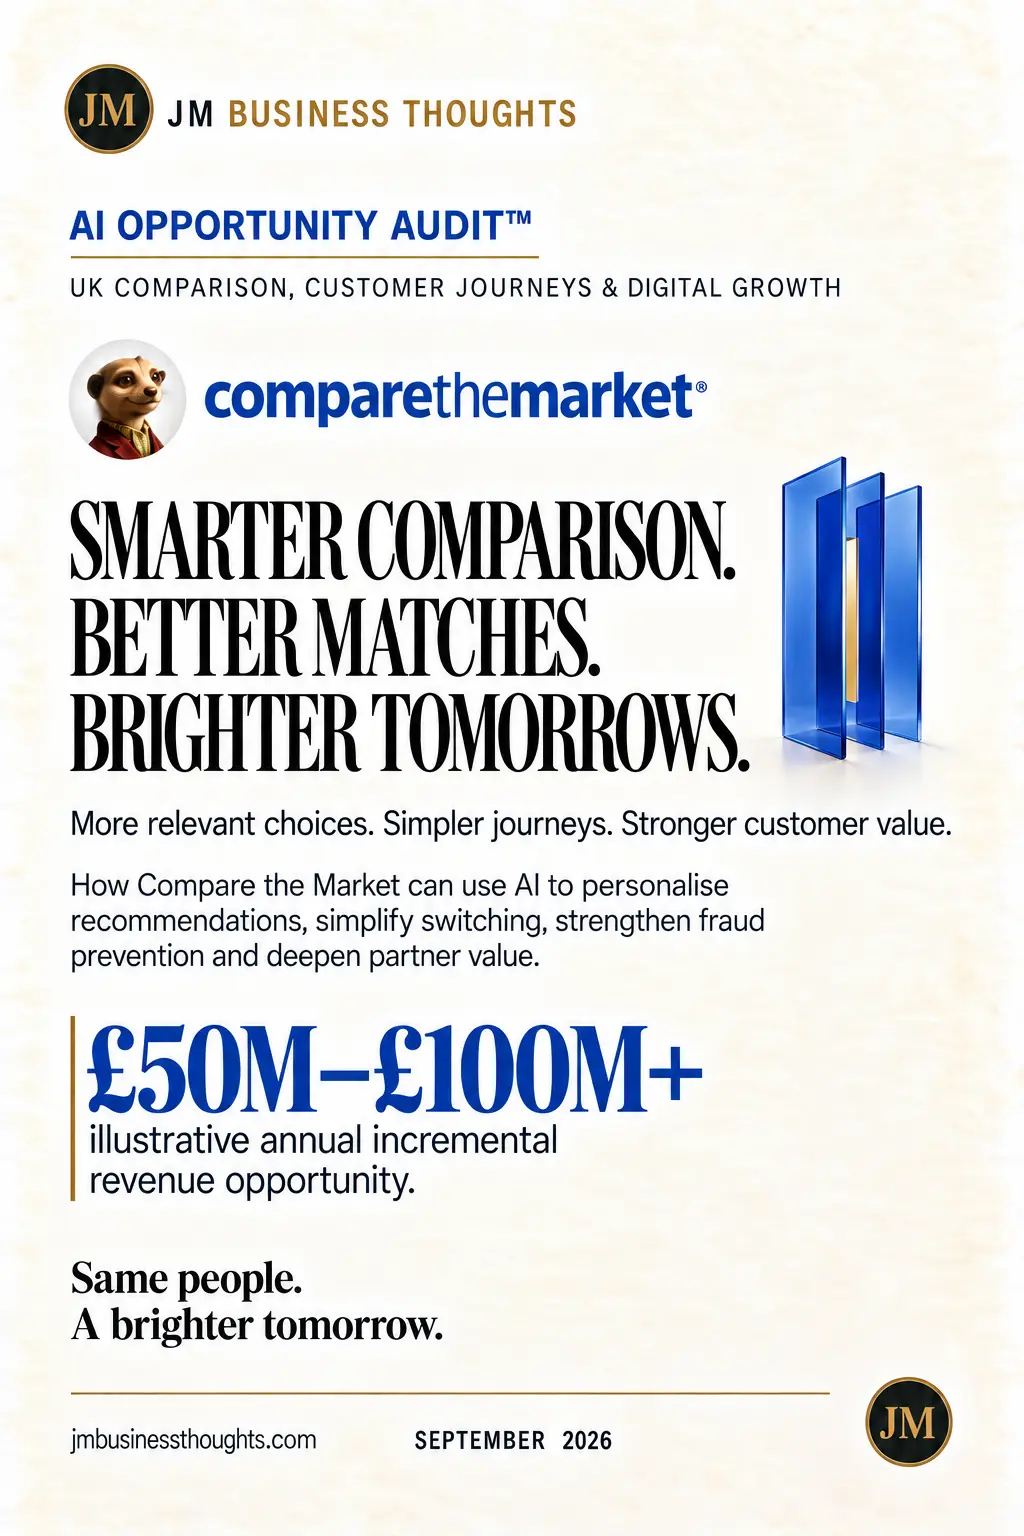
Compare the Market — Smarter Comparison. Better Matches. Brighter Tomorrows. report cover
Compare the Market — Smarter Comparison. Better Matches. Brighter Tomorrows.September 2026 · United Kingdom · 40M+ Adults Comparing Online · Institutional Coverage
01

Executive summary — a bigger tomorrow with AI

Comparethemarket has changed how the UK shops for insurance and household services. AI now offers the next step change — a more personal, predictive and seamless experience.

Four outcome pillars structure the case: happier customers, through more relevant recommendations and simpler journeys; higher conversion, turning more comparisons into completed policies; leaner operations, automating routine tasks and reducing cost; and stronger partnerships, delivering better leads and insights to insurer partners.

The strategic framing matters. AI can help Comparethemarket go beyond comparison — from finding the best deal today, to the right deal for a brighter tomorrow.

Headline sizing: +10–20% higher conversion rate, +£50–100M incremental annual revenue (illustrative), 20–30% operational cost savings, and 2–3x ROI within three years.

From finding the best deal today, to the right deal for a brighter tomorrow.
  • Four pillars: happier customers, higher conversion, leaner operations, stronger partnerships
  • +10–20% higher conversion rate
  • +£50–100M incremental annual revenue (illustrative)
  • 20–30% operational cost savings · 2–3x ROI within three years
02

Market and digital overview — a leading UK brand in a growing, digital-first market

The market context: a £65BN+ UK general insurance opportunity, 40M+ UK adults comparing financial products online, the most recognised price comparison brand in the UK, and 70%+ of policies now researched online.

A strong digital foundation underpins the case: high brand trust and awareness; a multi-product platform across insurance, energy, broadband and mobile; a large, loyal customer base; an established partner insurer network; and data-rich customer journeys.

Five key market trends shape the environment: growing demand for personalisation; mobile-first comparison journeys; a rising focus on fraud prevention and verification; increased competition and digital innovation; and greater emphasis on value, trust and customer outcomes.

The regulatory overlay is not incidental. Consumer-outcome expectations push the category away from 'cheapest headline price' toward demonstrable suitability — which is a modelling problem, and therefore an advantage for whoever builds the model first.

Regulation is pushing the category from cheapest price toward demonstrable suitability. That is a modelling problem.
  • £65B+ UK general insurance market · 40M+ adults comparing online
  • #1 most recognised price comparison brand in the UK
  • 70%+ of policies now researched online
  • Multi-product platform: insurance, energy, broadband, mobile
03

The customer layer — search, switching, segmentation and conversion

Search and recommendation uses AI-powered search and recommendation to surface the most relevant policies for each customer in real time — replacing a ranked list with a match.

Insurance switching journeys predict the right time to switch and simplify the renewal and switching process with AI-guided journeys. Timing is the single most under-exploited signal in the category: the same customer converts at a materially different rate depending on when they are approached.

Customer segmentation uses AI to create dynamic micro-segments and tailor messaging, products and offers — a step change from broad demographic cohorts.

Conversion optimisation applies AI-driven testing and personalisation to increase quote-to-policy conversion rates. In a business where traffic is largely bought, conversion is the highest-leverage number on the page.

Where traffic is bought, conversion is the highest-leverage number on the page.
  • 1 Search and recommendation — relevance in real time
  • 2 Insurance switching journeys — predicted timing, guided switching
  • 3 Customer segmentation — dynamic micro-segments
  • 4 Conversion optimisation — AI-driven testing and personalisation
04

The trust and operations layer — fraud, marketing, service and partners

Fraud and verification deploys advanced AI models for identity verification, fraud detection and risk assessment — protecting both the customer and the partner insurer, and improving the quality of the leads passed downstream.

Marketing efficiency optimises media spend, targeting and creative with AI-driven insights and automation. For a brand this heavily marketed, media efficiency is a first-order profit lever, not a marketing-department metric.

Call-centre automation uses AI assistants to handle routine enquiries, support agents and improve customer satisfaction — the principal contributor to the 20–30% operational cost saving.

Partner intelligence provides insurer partners with AI-driven market insights, demand signals and customer trends — monetising the platform's aggregate view rather than only its individual transactions. This is the multiplier that changes the business model, not just the margin.

Partner intelligence monetises the aggregate view — the one asset a single insurer cannot build.
  • 5 Fraud and verification — identity, detection, risk assessment
  • 6 Marketing efficiency — media spend, targeting, creative
  • 7 Call-centre automation — routine enquiries and agent support
  • 7 Partner intelligence — market insights and demand signals to insurers
05

Financial impact model (illustrative) — a significant opportunity for growth and efficiency

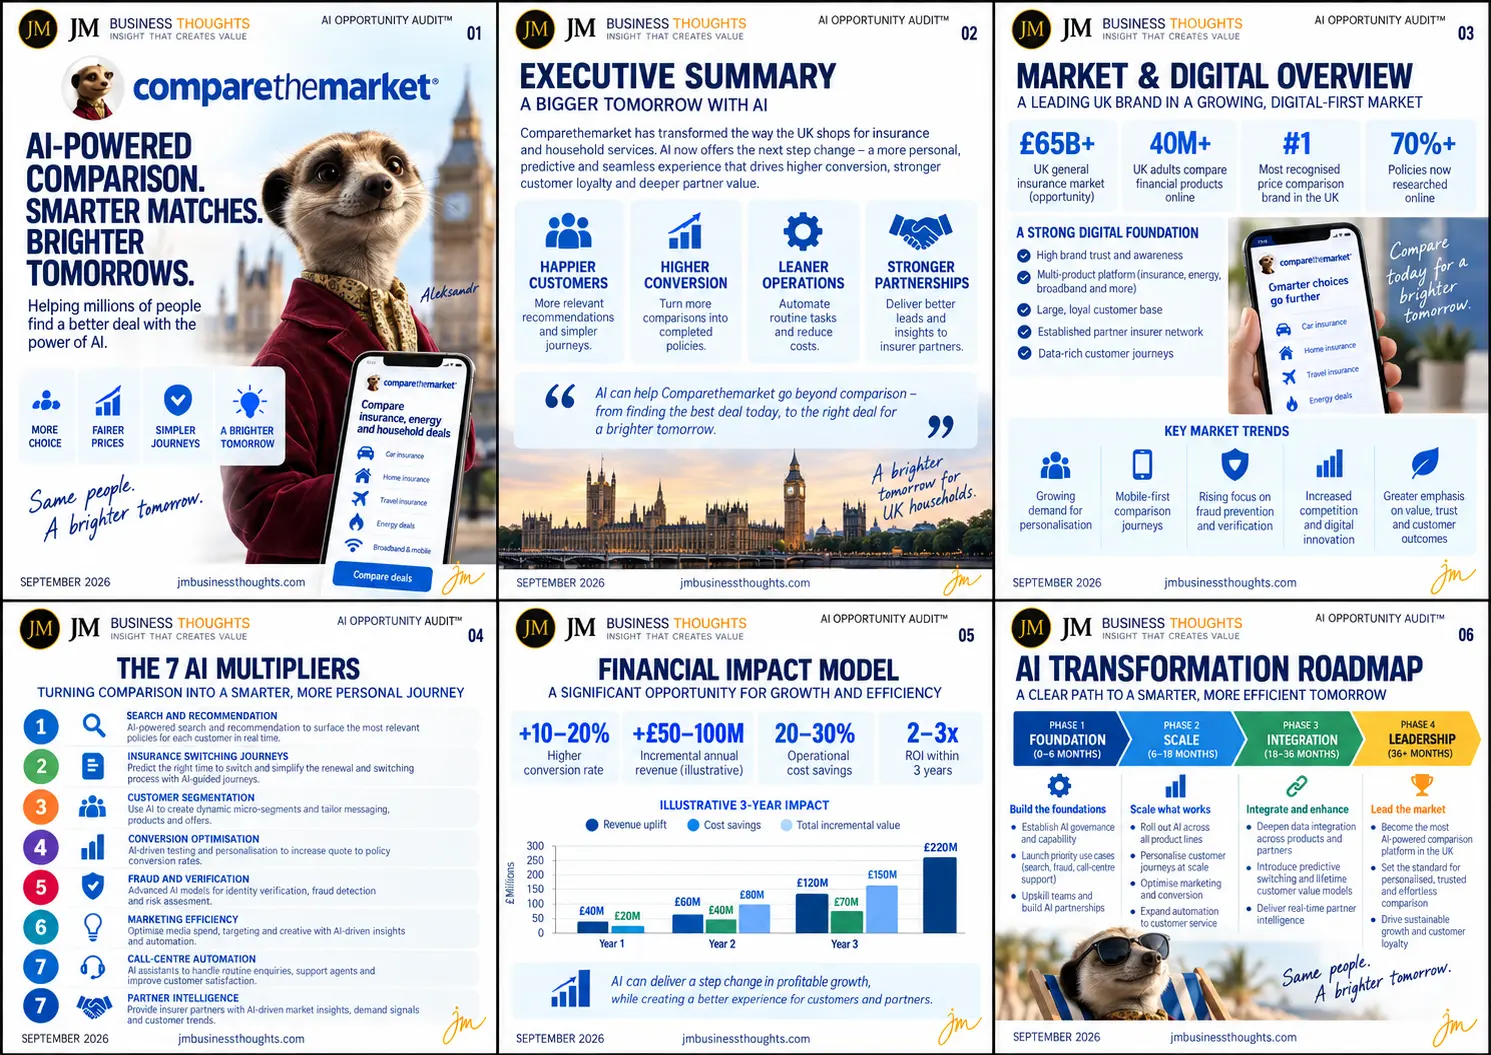
Headline metrics: +10–20% higher conversion rate; +£50–100M incremental annual revenue (illustrative); 20–30% operational cost savings; and 2–3x ROI within three years.

Illustrative three-year impact: Year 1 delivers £40M of revenue uplift and £20M of cost savings; Year 2 delivers £60M and £40M, for £80M of total incremental value; Year 3 delivers £120M and £70M, for £150M of total incremental value building to £220M cumulative.

The shape of the curve matters more than the endpoint. Conversion and marketing efficiency deliver early because they act on existing traffic; partner intelligence and switching journeys compound later because they require data maturity and partner integration.

AI can deliver a step change in profitable growth, while creating a better experience for customers and partners. Illustrative JM Business Thoughts scenario based on public data and market benchmarks — not company guidance.

£40M → £80M → £150M of incremental value across three years, £220M cumulative.
  • Year 1: £40M revenue uplift · £20M cost savings
  • Year 2: £60M revenue uplift · £40M cost savings · £80M total
  • Year 3: £120M revenue uplift · £70M cost savings · £150M total
  • 2–3x ROI within three years
06

AI transformation roadmap — four phases

Phase 1, Foundation (0–6 months): establish AI governance and capability, launch priority use cases across search, fraud and call-centre support, and upskill teams while building AI partnerships.

Phase 2, Scale (6–18 months): roll out AI across all product lines, personalise customer journeys at scale, optimise marketing and conversion, and expand automation into customer service.

Phase 3, Integration (18–36 months): deepen data integration across products and partners, introduce predictive switching and lifetime customer value models, and deliver real-time partner intelligence.

Phase 4, Leadership (36+ months): become the most AI-powered comparison platform in the UK, set the standard for personalised, trusted and effortless comparison, and drive sustainable growth and customer loyalty.
Same people. A brighter tomorrow.
  • Phase 1 Foundation · 0–6 months
  • Phase 2 Scale · 6–18 months
  • Phase 3 Integration · 18–36 months
  • Phase 4 Leadership · 36+ months
07

Sources and method

Market data: UK general insurance market sizing, online comparison penetration and brand recognition benchmarks (2025–2026).

Platform context: Comparethemarket's multi-product footprint across insurance, energy, broadband and mobile, and its established partner insurer network.

Method note: each multiplier is sized independently against comparison volume, conversion economics and marketing spend, then netted for overlap before the total incremental revenue range is stated.

Illustrative JM Business Thoughts scenario based on public data and market benchmarks — not company guidance.

The Multiplier Framework

7 compounding levers

The seven AI multipliers turning comparison into a smarter, more personal journey — aggregating to £50M – £100M+ of incremental annual revenue, 20–30% operational cost savings and 2–3x ROI within three years.

01

Search & Recommendation

Surface the most relevant policies for each customer in real time.

  • AI-powered search ranking on customer context
  • Suitability-weighted recommendation, not price-only
  • Real-time relevance across product lines

Outcome · Higher quote quality and engagement

02

Insurance Switching Journeys

Predict the right time to switch and simplify renewal.

  • Renewal timing prediction per household
  • AI-guided switching journeys
  • Friction removal at the point of decision

Outcome · Materially higher switch completion

03

Customer Segmentation

Dynamic micro-segments replacing broad cohorts.

  • Behavioural and household segmentation
  • Tailored messaging, products and offers
  • Segment-level lifetime value modelling

Outcome · Better targeting economics

04

Conversion Optimisation

Turn more quotes into policies.

  • AI-driven experimentation at journey level
  • Personalised page and offer sequencing
  • Abandonment prediction and recovery

Outcome · +10–20% conversion rate

05

Fraud & Verification

Protect the customer, the platform and the partner.

  • Identity verification at quote stage
  • AI fraud detection and risk scoring
  • Cleaner leads passed to insurers

Outcome · Lower losses, higher partner trust

06

Marketing Efficiency & Service Automation

Lower cost per acquisition and cost to serve.

  • AI media spend, targeting and creative optimisation
  • AI assistants for routine enquiries
  • Agent augmentation and quality analytics

Outcome · 20–30% operational cost savings

07

Partner Intelligence

Monetise the aggregate market view.

  • AI-driven market insight products for insurers
  • Demand signal and pricing trend feeds
  • Customer trend reporting at portfolio level

Outcome · New partner revenue streams

Compare the Market — Smarter Comparison. Better Matches. Brighter Tomorrows. full strategic breakdown
AI Opportunity Audit™ · Comparethemarket — the full six-page institutional report covering the cover and value pillars, the executive summary, the market and digital overview, the seven AI multipliers, the illustrative financial impact model with three-year build, and the four-phase AI transformation roadmap.

The Verdict

The UK's most recognised comparison brand, in a £65BN+ market where 70%+ of policies are already researched online — with a comparison experience that is still, structurally, a ranked list. Seven multipliers turn it into a match: £50M – £100M+ of incremental annual revenue, +10–20% conversion, 20–30% operational cost savings and 2–3x ROI within three years, building to £220M of cumulative value across three years. Same people. A brighter tomorrow.

JM founder signature
68 · PureGym — Fitness At Scale. More Personal. More Inclusive.67 · SIXT — Smarter Mobility. Greater Availability. A More Connected Tomorrow.66 · Sendwave — Money That Moves With Intelligence.65 · McDonald’s — Serving The Future With AI.62 · Primark — Affordable Fashion. Greater Possibilities With AI.61 · Starbucks — Smarter Stores. Stronger Loyalty. Better Margins.60 · IKEA — AI-Powered Home Retail at Global Scale59 · H&M — Smarter Fashion. Brighter Tomorrow.58 · WeWork — The Value Wasn't Lost. It Was Mispriced.57 · Yahoo — The Value Wasn't Lost. It Was Mispriced.56 · Nando's UK — Smarter Restaurants. Stronger Loyalty. Better Margins.55 · The Amplifier54 · The Body Shop53 · Arcadia Group52 · Cazoo51 · Blockbuster50 · Carpetright49 · Wilko48 · Mothercare47 · Phones 4u46 · Farfetch45 · Jumia44 · Toys ‘R’ Us43 · The Collateral Gap — Part One41 · The Amplifier40 · Africa Bee Farming39 · Kenya Airways38 · Africa Greenhouse Farming37 · Uganda Tourism Board36 · Boots UK35 · Biffa (UK)34 · NatWest33 · Skip Hire Companies UK33 · The Audit32 · The Lean Company31 · Africa Mushroom Farming29 · The Rider Economy Nobody Verified28 · The Layer Underneath the Layer27 · Independent Timber Yards & Jewson Timber26 · Link Up TV & GRM Daily25 · East African Portland Cement42 · International Student Credential & Financial Verification — Part One24 · The Supply Chain Inside the Supply Chain23 · The White Space, Mapped22 · The Real Opportunity21 · Greencore20 · West Ham United19 · Roofings Group Uganda18 · Mombasa Port17 · Auto Trader UK16 · Uganda Coffee Development Authority15 · Brookside Dairy14 · GraceKennedy13 · Rightmove12 · Manchester United11 · Greggs30 · Twiga Foods10 · Uchumi09 · Konga08 · Edcon09 · GAME07 · Debenhams06 · Claire's05 · Boohoo04 · Argos