IKEA — AI-Powered Home Retail at Global Scale research poster
All Research

The Hidden AI Operating System Audit Series™

Where AI creates new profit pools—not just productivity.

60AI Opportunity Audit™ 18 min readSeptember 2026
Coverage · Global · Home Furnishings, Retail & Digital Experience · Institutional CoverageSector · Home Furnishings, Omnichannel Retail & Supply ChainFormat · Six-page audit

IKEA — AI-Powered Home Retail at Global ScaleAn opportunity audit across demand, personalisation and operations.

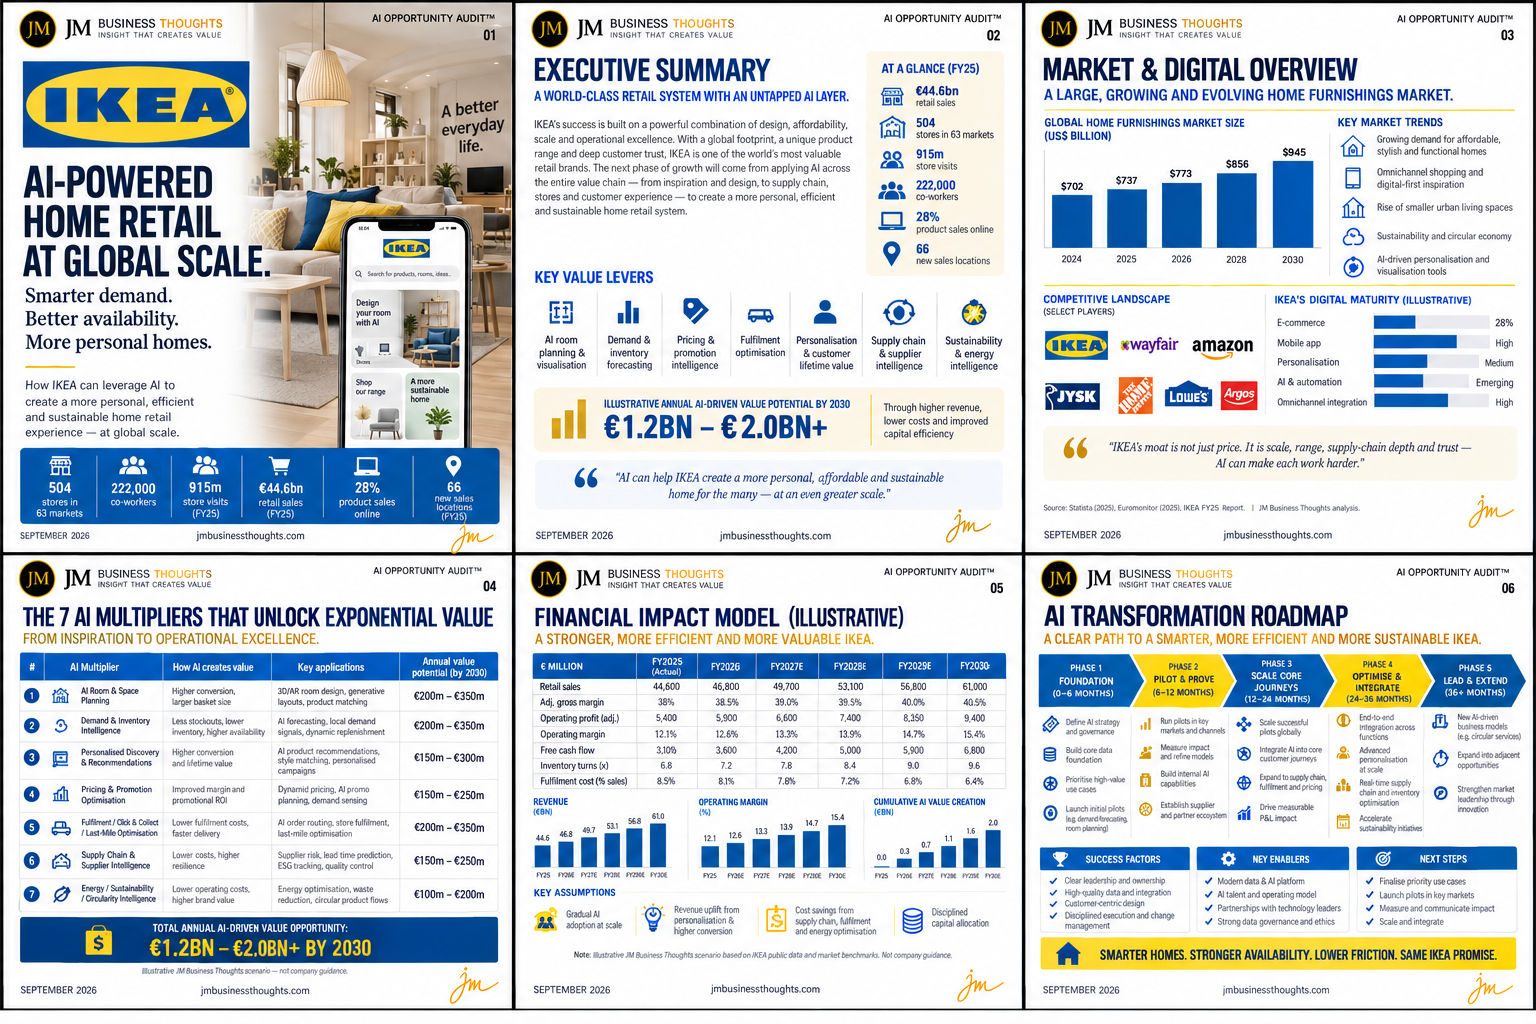
IKEA operates 504 stores across 63 markets with 222,000 co-workers, 915m store visits and €44.6bn of retail sales in FY25, with 28% of product sales online and 66 new sales locations added. It is a world-class retail system with an untapped AI layer. This audit sizes €1.2BN–€2.0BN+ of illustrative annual AI-driven value by 2030 across seven multipliers — room and space planning, demand and inventory intelligence, personalised discovery, pricing and promotion, fulfilment and last mile, supply and supplier intelligence, and energy, sustainability and circularity — delivered through higher revenue, lower costs and improved capital efficiency.

Annual AI Value by 2030

€1.2BN – €2.0BN+

Retail Sales (FY25)

€44.6BN

Stores / Markets

504 / 63

Co-workers

222,000

Store Visits (FY25)

915M

Product Sales Online

28%

New Sales Locations (FY25)

66

Value Multipliers

7

The Thesis

IKEA's moat is not price. It is scale, range, supply-chain depth and trust — and AI can make each of those work harder. The company's success is built on a powerful combination of design, affordability, scale and operational excellence, expressed through a global footprint, a unique product range and unusually deep customer trust. What that system has not yet done is apply intelligence uniformly across the value chain: from inspiration and design, through supply chain, stores and customer experience. The distinctive feature of the IKEA opportunity is that its highest-value AI use case is not a back-office one. Room and space planning — 3D and AR room design, generative layouts and product matching — sits at the exact point where a customer's intention becomes a basket, and carries an illustrative €200m–€350m of annual value on its own. Around it, demand intelligence, personalised discovery, pricing, fulfilment, supplier intelligence and circularity compound into €1.2BN–€2.0BN+ by 2030. Smarter homes. Stronger availability. Lower friction. Same IKEA promise.

Exhibit · Report Cover

60 · AI Opportunity Audit™

IKEA — AI-Powered Home Retail at Global Scale report cover
IKEA — AI-Powered Home Retail at Global ScaleSeptember 2026 · Global · Home Furnishings, Retail & Digital Experience · Institutional Coverage
01

Executive summary — a world-class retail system with an untapped AI layer

IKEA's FY25 position is a system at scale: 504 stores in 63 markets, 222,000 co-workers, 915m store visits, €44.6bn retail sales, 28% of product sales online and 66 new sales locations. Few retail businesses have a comparable combination of physical reach and digital adoption.

The next phase of growth will come from applying AI across the entire value chain — from inspiration and design, to supply chain, stores and customer experience — to create a more personal, efficient and sustainable home retail system.

Seven key value levers structure the audit: AI room planning and visualisation; demand and inventory forecasting; pricing and promotion intelligence; fulfilment optimisation; personalisation and customer lifetime value; supply chain and supplier intelligence; and sustainability and energy intelligence.

Illustrative annual AI-driven value potential by 2030 is €1.2BN–€2.0BN+, delivered through higher revenue, lower costs and improved capital efficiency. AI can help IKEA create a more personal, affordable and sustainable home for the many — at an even greater scale.

IKEA's moat is not just price. It is scale, range, supply-chain depth and trust — AI can make each work harder.
  • €44.6bn retail sales · 504 stores · 63 markets · 222,000 co-workers
  • 915m store visits and 28% of product sales online in FY25
  • Seven value levers spanning inspiration to fulfilment
  • €1.2BN–€2.0BN+ illustrative annual AI-driven value by 2030
02

Market & digital overview — a large, growing home furnishings market

The global home furnishings market is modelled at $702BN (2024), $737BN (2025), $773BN (2026), $856BN (2028) and $945BN (2030) — a steady expansion that rewards operators able to convert scale into service rather than simply into square metres.

Five market trends define the environment: growing demand for affordable, stylish and functional homes; omnichannel shopping and digital-first inspiration; the rise of smaller urban living spaces; sustainability and the circular economy; and AI-driven personalisation and visualisation tools.

The urban-space trend is strategically significant for IKEA specifically. Smaller homes make space planning harder and therefore make planning assistance more valuable — which is precisely why room and space planning ranks first among the multipliers rather than as a marketing feature.

Competitively, IKEA is benchmarked against Wayfair, Amazon, JYSK, The Home Depot, Lowe's and Argos. On digital maturity, IKEA's illustrative position is: e-commerce 28%; mobile app high; personalisation medium; AI and automation emerging; omnichannel integration high. The gap is personalisation and automation — not reach.

Smaller homes make space planning harder — and therefore make planning assistance more valuable.
  • Market $702BN (2024) → $945BN (2030)
  • Digital-first inspiration now precedes most physical visits
  • IKEA digital maturity: high omnichannel, emerging AI and automation
  • The competitive gap is personalisation and automation, not scale
03

The inspiration layer — room planning, discovery and personalisation

AI room and space planning is the leading multiplier at an illustrative €200m–€350m annually. 3D and AR room design, generative layouts and product matching convert browsing into specification — driving higher conversion and larger basket size at the moment intention forms.

Personalised discovery and recommendations (€150m–€300m) applies AI product recommendations, style matching and personalised campaigns to raise conversion and lifetime value. IKEA's range breadth is an advantage only if customers can navigate it; recommendation is the navigation layer.

The two levers work as one system. A room plan is the richest possible expression of customer intent — it declares space, style, budget and adjacency simultaneously — and is therefore the highest-quality input any recommendation engine could receive.

This is also the most defensible part of the opportunity. Competitors can match price and can match delivery; matching a planning tool trained on IKEA's own modular range and 915m annual store visits is considerably harder.

A room plan is the richest expression of intent a retailer will ever receive — space, style, budget and adjacency at once.
  • 01 AI room & space planning · €200m–€350m
  • 03 Personalised discovery & recommendations · €150m–€300m
  • Planning output becomes the highest-quality recommendation input
  • The most defensible lever in the audit
04

The operations layer — inventory, pricing, fulfilment and supply

Demand and inventory intelligence (€200m–€350m) applies AI forecasting, local demand signals and dynamic replenishment to reduce stockouts, lower inventory and improve availability — addressing availability, historically the most common friction in a large-format range business.

Pricing and promotion optimisation (€150m–€250m) uses dynamic pricing, AI promo planning and demand sensing to improve margin and promotional return without compromising the affordability position the brand is built on.

Fulfilment, click and collect and last mile (€200m–€350m) lowers fulfilment cost and lead time through AI routing, store fulfilment and last-mile optimisation. In bulky-goods retail, the last mile is a disproportionate share of cost to serve.

Supply chain and supplier intelligence (€150m–€250m) adds supplier risk, lead-time prediction, ESG tracking and quality control — building resilience rather than reacting to disruption. Energy, sustainability and circularity intelligence (€100m–€200m) lowers operating cost via energy optimisation, waste reduction and circular product flows.

In bulky-goods retail, the last mile is a disproportionate share of the cost to serve.
  • 02 Demand & inventory intelligence · €200m–€350m
  • 04 Pricing & promotion optimisation · €150m–€250m
  • 05 Fulfilment / click & collect / last mile · €200m–€350m
  • 06 Supply & supplier intelligence · €150m–€250m · 07 Energy & circularity · €100m–€200m
05

Financial impact model (illustrative) — a stronger, more efficient IKEA

Retail sales are modelled from €44,600m (FY25 actual) to €46,800m (FY26E), €49,700m (FY27E), €53,100m (FY28E), €56,800m (FY29E) and €61,000m (FY30E), with adjusted gross margin improving from 38.0% to 40.5% across the period.

Operating profit (adjusted) rises from €5,400m to €9,400m and operating margin from 12.1% to 15.4%. Free cash flow moves from €3,100m to €6,800m; inventory turns improve from 6.8x to 9.6x; and fulfilment cost falls from 8.5% of sales to 6.4%.

Cumulative AI value creation builds through the model — €0.3BN, €0.7BN, €1.1BN, €1.6BN and €2.0BN — reaching the stated €1.2BN–€2.0BN+ annual range by 2030.

Key assumptions: gradual AI adoption at scale; revenue uplift from personalisation and higher conversion; cost savings from supply chain, fulfilment and energy optimisation; and disciplined capital allocation. Illustrative JM Business Thoughts scenario based on IKEA public data and market benchmarks — not company guidance.

Inventory turns from 6.8x to 9.6x is a capital-efficiency story before it is a technology story.
  • Retail sales €44.6bn (FY25) → €61.0bn (FY30E)
  • Operating margin 12.1% → 15.4% · free cash flow €3.1bn → €6.8bn
  • Fulfilment cost 8.5% → 6.4% of sales
  • Cumulative AI value creation €0.3BN → €2.0BN
06

AI transformation roadmap — five phases, 36+ months

Phase 1, Foundation (0–6 months): define the AI strategy and governance, build the core data foundation, prioritise high-value use cases and launch initial pilots such as demand forecasting and room planning.

Phase 2, Pilot & Prove (6–12 months): run pilots in key markets and channels, measure impact and refine models, build internal AI capabilities and establish the supplier and partner ecosystem.

Phase 3, Scale Core Journeys (12–24 months): scale successful pilots globally, integrate AI into core customer journeys, extend to supply chain, fulfilment and pricing, and drive measurable P&L impact.

Phase 4, Optimise & Integrate (24–36 months): end-to-end integration across functions, advanced personalisation at scale, real-time supply chain and inventory optimisation, and accelerated sustainability initiatives. Phase 5, Lead & Extend (36+ months): new AI-driven business models such as circular services, expansion into adjacent opportunities and strengthened market leadership through innovation.

Success factors: clear leadership and ownership; high-quality data and integration; a customer-centric design stance; and disciplined execution and change management. Key enablers: a modern data and AI platform, AI talent and operating model, partnerships with technology leaders, and strong data governance and ethics.

Prove in market, then scale globally — the sequence that separates measurable P&L impact from pilot theatre.
  • Phase 1 Foundation · 0–6 months · Phase 2 Pilot & Prove · 6–12 months
  • Phase 3 Scale Core Journeys · 12–24 months
  • Phase 4 Optimise & Integrate · 24–36 months
  • Phase 5 Lead & Extend · 36+ months — circular services and new AI-driven models
07

Sources and method

Company data: IKEA FY25 report — retail sales, store and market counts, co-worker numbers, store visits, online share and new sales locations.

Market sizing and competitive landscape: Statista (2025) and Euromonitor (2025) home furnishings market data; JM Business Thoughts analysis.

Value ranges are sized per multiplier against disclosed scale and sector benchmarks for conversion, inventory turns, fulfilment cost and energy intensity, then netted for overlap before the total range is stated.

Method note: this is an illustrative JM Business Thoughts scenario, not company guidance. Digital maturity assessments are directional and analyst-assigned rather than company-reported.

The Multiplier Framework

7 compounding levers

The seven AI multipliers that unlock exponential value — from inspiration to operational excellence.

01

AI Room & Space Planning

Higher conversion, larger basket size · €200m–€350m by 2030.

  • Deploy 3D and AR room design with generative layout suggestions
  • Match products automatically to the planned space and budget
  • Feed completed plans back as first-party intent data

Outcome · The moment intention forms becomes a measurable, ownable commercial asset.

02

Demand & Inventory Intelligence

Fewer stockouts, lower inventory, higher availability · €200m–€350m.

  • Forecast with local demand signals rather than national averages
  • Run dynamic replenishment across stores and fulfilment nodes
  • Target inventory turns as an explicit board metric

Outcome · Availability improves while working capital falls — 6.8x to 9.6x inventory turns.

03

Personalised Discovery & Recommendations

Higher conversion and lifetime value · €150m–€300m.

  • Apply AI product recommendation and style matching across the range
  • Personalise campaigns against real household context
  • Make range breadth navigable instead of overwhelming

Outcome · Scale of range converts into relevance rather than choice paralysis.

04

Pricing & Promotion Optimisation

Improved margin and promotional ROI · €150m–€250m.

  • Use dynamic pricing and demand sensing within affordability guardrails
  • Plan promotions on predicted rather than historic elasticity
  • Protect the price-leadership position while recovering margin

Outcome · Margin improves without breaking the affordability promise the brand is built on.

05

Fulfilment, Click & Collect, Last Mile

Lower fulfilment cost and lead time · €200m–€350m.

  • Optimise AI routing and store-based fulfilment
  • Match order to node on true cost to serve, not proximity alone
  • Compress last-mile cost in a bulky-goods context

Outcome · Fulfilment cost falls from 8.5% to 6.4% of sales on the illustrative model.

06

Supply Chain & Supplier Intelligence

Lower costs, higher resilience · €150m–€250m.

  • Predict supplier risk and lead time before disruption lands
  • Track ESG and quality control across the supplier base
  • Build resilience into planning rather than into buffer stock

Outcome · Disruption is anticipated and priced rather than absorbed after the fact.

07

Energy, Sustainability & Circularity Intelligence

Lower operating costs, higher brand value · €100m–€200m.

  • Optimise energy across stores, warehouses and fulfilment
  • Reduce waste through predictive product and packaging flows
  • Build circular product flows on product-level data

Outcome · Sustainability becomes an operating-cost line item with a return, not a reporting obligation.

IKEA — AI-Powered Home Retail at Global Scale full strategic breakdown
IKEA · AI Opportunity Audit™ — full six-page brief: 01 Cover and FY25 key figures, 02 Executive Summary and key value levers, 03 Market & Digital Overview with competitive landscape and digital maturity, 04 The 7 AI Multipliers with value ranges, 05 Financial Impact Model FY25–FY30E (illustrative), 06 AI Transformation Roadmap across five phases.

The Verdict

IKEA is already a world-class retail system; what it lacks is an intelligence layer running across it. FY25's €44.6bn of retail sales, 915m store visits and 28% online share represent one of the richest demand datasets in physical retail, and it is currently used departmentally rather than systemically. The audit's distinctive finding is where the value concentrates: not in back-office automation but in room and space planning, the point at which a customer's intent becomes a specification — €200m–€350m on its own, and the highest-quality input into every other lever. Add demand intelligence, personalised discovery, pricing, fulfilment, supplier intelligence and circularity, and the illustrative position is €1.2BN–€2.0BN+ annually by 2030, with operating margin moving 12.1% to 15.4% and inventory turns from 6.8x to 9.6x. Smarter homes. Stronger availability. Lower friction. Same IKEA promise.

JM founder signature
68 · PureGym — Fitness At Scale. More Personal. More Inclusive.67 · SIXT — Smarter Mobility. Greater Availability. A More Connected Tomorrow.66 · Sendwave — Money That Moves With Intelligence.65 · McDonald’s — Serving The Future With AI.64 · Compare the Market — Smarter Comparison. Better Matches. Brighter Tomorrows.63 · WeBuyAnyCar — Smarter Pricing. Faster Offers. Better Conversion.62 · Primark — Affordable Fashion. Greater Possibilities With AI.61 · Starbucks — Smarter Stores. Stronger Loyalty. Better Margins.58 · WeWork — The Value Wasn't Lost. It Was Mispriced.57 · Yahoo — The Value Wasn't Lost. It Was Mispriced.56 · Nando's UK — Smarter Restaurants. Stronger Loyalty. Better Margins.55 · The Amplifier54 · The Body Shop53 · Arcadia Group52 · Cazoo51 · Blockbuster50 · Carpetright49 · Wilko48 · Mothercare47 · Phones 4u46 · Farfetch45 · Jumia44 · Toys ‘R’ Us43 · The Collateral Gap — Part One41 · The Amplifier40 · Africa Bee Farming39 · Kenya Airways38 · Africa Greenhouse Farming37 · Uganda Tourism Board36 · Boots UK35 · Biffa (UK)34 · NatWest33 · Skip Hire Companies UK33 · The Audit32 · The Lean Company31 · Africa Mushroom Farming29 · The Rider Economy Nobody Verified28 · The Layer Underneath the Layer27 · Independent Timber Yards & Jewson Timber26 · Link Up TV & GRM Daily25 · East African Portland Cement42 · International Student Credential & Financial Verification — Part One24 · The Supply Chain Inside the Supply Chain23 · The White Space, Mapped22 · The Real Opportunity21 · Greencore20 · West Ham United19 · Roofings Group Uganda18 · Mombasa Port17 · Auto Trader UK16 · Uganda Coffee Development Authority15 · Brookside Dairy14 · GraceKennedy13 · Rightmove12 · Manchester United11 · Greggs30 · Twiga Foods10 · Uchumi09 · Konga08 · Edcon09 · GAME07 · Debenhams06 · Claire's05 · Boohoo04 · Argos