Cazoo: The Value Wasn’t Lost. It Was Mispriced. research poster
All Research
52Mispriced Assets™ 20 min readSeptember 2026
Coverage · United Kingdom & Europe · Online Used Car Retail · Institutional CoverageSector · Automotive Retail · Platform, Logistics & Data InfrastructureFormat · Six-page audit

CazooA Case Study In Strategic Value Overlooked, Not Destroyed.

Cazoo was a pioneer. Founded in 2018, it built one of the world’s first end-to-end online used car platforms — combining technology, logistics and customer experience at scale — reaching a £7BN+ peak valuation, £1.1BN of peak annual revenue and 7M+ customers served. Overcapitalisation, market timing, supply chain volatility and unit economics pressure led to its collapse, not a lack of relevance. This audit identifies £3.4BN+ of overlooked value and sizes the pathways to recover it.

Founded In The UK

2018

IPO On NYSE

2021

Peak Market Valuation

£7BN+

Peak Annual Revenue (FY2021)

£1.1BN

Customers Served

7M+

Vehicles At Peak

4,000+

The Mispricing Gap

£3.4BN+

Enterprise Value Potential

£4.0BN+

The Thesis

Cazoo is treated as proof that online used car retail does not work. The evidence says something narrower: Cazoo’s capital structure did not work. The consumer thesis — that buyers want transparency, convenience and trust in a market historically defined by the absence of all three — has been validated everywhere it has been properly capitalised, most visibly by Carvana in the United States. The global used car market is $1.6TN+ and growing at 5–7% a year, with 70% of sales still offline and the digital shift accelerating. Cazoo built the brand, the technology platform, the customer database, the logistics operation and the inventory infrastructure, then priced them at nil in insolvency. At collapse those five components carried an estimated £1.15BN of realisable value against £4.3BN+ of intrinsic value — a £3.4BN+ mispricing gap. Not destroyed. Mispriced.

Exhibit · Report Cover

52 · Mispriced Assets™

Cazoo: The Value Wasn’t Lost. It Was Mispriced. report cover
Cazoo: The Value Wasn’t Lost. It Was Mispriced.September 2026 · United Kingdom & Europe · Online Used Car Retail · Institutional Coverage
01

Executive summary: a pioneer, priced as a failure

Cazoo was a pioneer. It built one of the world’s first end-to-end online used car platforms, combining technology, logistics and customer experience at scale.

At its peak it achieved unicorn status with a valuation of over £7BN, £1.1BN of annual revenue in FY2021, 7M+ customers served and 4,000+ vehicles at peak inventory.

A combination of overcapitalisation, market timing, supply chain volatility and unit economics pressure led to its collapse — not a lack of relevance.

This report identifies the intrinsic value that was overlooked, benchmarks it against today’s auto retail landscape and outlines the pathways to unlock significant recovery value.

Key value drivers: the technology platform, nationwide logistics, brand recognition, data and CRM assets, supply chain infrastructure and category growth.

£1.15BN at collapse against £4.3BN+ of intrinsic value. A £3.4BN+ mispricing gap.
  • 2018 founded in the UK; 2021 IPO on NYSE
  • £7BN+ peak market valuation; £1.1BN peak revenue
  • 7M+ customers served; 4,000+ vehicles at peak
  • First mover — pioneered online used car retail at scale
02

The mispricing gap: component by component

The mispricing is measurable because the assets are separable and each has a market comparator.

Brand equity: £250M at collapse against £750M+ intrinsic — 3.0x upside. Cazoo spent at scale on brand building including national TV and sports sponsorship, achieving recognition no new entrant can replicate cheaply.

Technology platform: £300M against £900M+ — 3.0x. An end-to-end stack covering search, listing, financing, checkout, delivery and aftercare is a multi-year build even fully funded.

Customer database: £150M against £400M+ — 2.5x. Seven million customer records in a category with a three-to-five year repurchase cycle is a remarketing annuity.

Logistics and operations: £250M against £750M+ — 3.0x. Nationwide vehicle collection, preparation and home delivery is the operational moat in online auto retail.

Inventory and supply chain: £200M against £600M+ — 3.0x. Sourcing relationships, reconditioning capability and trade networks were built, not bought.

Total: £1.15BN against £4.3BN+ — a £3.4BN+ gap of overlooked value. Values are estimates based on public data, real estate comparables and brand valuation models.

£3.4BN+ of overlooked value. Not destroyed. Mispriced.
  • Brand equity: £250M → £750M+ (3.0x)
  • Technology platform: £300M → £900M+ (3.0x)
  • Customer database: £150M → £400M+ (2.5x)
  • Logistics and operations: £250M → £750M+ (3.0x)
  • Inventory and supply chain: £200M → £600M+ (3.0x)
03

Market overview: $1.6TN, 70% still offline

The global used car market is massive, fragmented and rapidly shifting online. Consumers want transparency, convenience and trust — exactly where Cazoo was positioned to lead.

Market size is estimated at $1.6TN+ with a 5–7% CAGR through 2030. Seventy percent of sales remain offline and the digital shift is accelerating. Cazoo built the brand; the market simply moved faster than the business could adapt.

The lost giants benchmark is instructive. Cazoo: UK and global, £7BN+ peak, insolvent. Carvana: USA, $64BN, operational. Vroom: USA, $7.7BN, liquidated. AUTO1 Group: Europe, €6.5BN, operational. Shift: USA, $2.2BN, acquired.

The distribution of outcomes is the point. Two of five comparable platforms are operating today at multi-billion valuations. The model works where the capital structure survives the cycle.

Market dynamics: the shift to online car buying, consumer demand for convenience and transparency, supply chain and wholesale disruption, financing and margin pressure, high customer acquisition costs and a strong long-term demand outlook.

70% of a $1.6TN market is still offline — and Carvana trades at $64BN.
  • Global used car market: $1.6TN+, 5–7% CAGR to 2030
  • 70% of sales still offline; digital shift accelerating
  • Carvana operational at $64BN; AUTO1 operational at €6.5BN
  • Financing costs and acquisition costs are the binding constraints
04

Where the value actually leaks

Four leaks explain how a £1.1BN revenue business ran a (27%) adjusted EBITDA margin.

Acquisition cost is the first and largest. Online auto retail lives or dies on cost per acquired customer against gross profit per unit. Brand-led mass marketing without AI-driven targeting inverts that equation.

Reconditioning and inventory turn is the second. Every additional day a vehicle sits in preparation is financing cost plus depreciation. AI-driven demand forecasting and dynamic inventory allocation directly compress that cycle.

Pricing is the third. Used vehicles are individually priced assets with volatile residuals. Static pricing in a falling residual market is a margin transfer to the buyer; dynamic, elasticity-aware pricing recovers it.

Logistics utilisation is the fourth. Nationwide home delivery is an enormous asset when routed and loaded intelligently, and a fixed-cost anchor when it is not.

  • Acquisition gap: brand-led spend without targeted, measured conversion
  • Inventory gap: reconditioning days converting straight into financing cost
  • Pricing gap: static prices against volatile residual values
  • Logistics gap: delivery network utilisation and route density
05

Financial impact model: base FY2023 to Year 5

The illustrative model runs a turnaround and value creation scenario over five years from a base FY2023.

Revenue (£M): 450 → 650 → 850 → 1,050 → 1,250 → 1,450. Gross margin: 7% → 9% → 11% → 12% → 13% → 13%.

Adjusted EBITDA (£M): (120) → (40) → 20 → 60 → 90 → 120, with adjusted EBITDA margin moving (27%) → (6%) → 2% → 6% → 7% → 8%. Free cash flow (£M): (150) → (60) → 10 → 40 → 70 → 100.

Enterprise value (£BN) moves — → 1.0 → 1.8 → 2.6 → 3.4 → 4.0+, with AI-driven value created (£BN) of — → 0.2 → 0.4 → 0.6 → 0.8 → 1.0+.

Cumulative value creation over five years: cost savings of 15–20% worth £100M – £200M; revenue uplift of 20–30% worth £300M – £500M; margin uplift of 2–4% worth £100M – £200M; total annual value by year five of £4.0BN+ of enterprise value potential.

Key assumptions: market demand continues to grow, a platform relaunch that is lean and capital efficient, inventory optimisation, lower customer acquisition cost and improved unit economics.

Revenue £450M → £1.45BN. Enterprise value to £4.0BN+ over five years.
  • Revenue (£M): 450 → 650 → 850 → 1,050 → 1,250 → 1,450
  • Adjusted EBITDA (£M): (120) → (40) → 20 → 60 → 90 → 120
  • Free cash flow (£M): (150) → (60) → 10 → 40 → 70 → 100
  • Enterprise value (£BN): 1.0 → 1.8 → 2.6 → 3.4 → 4.0+
  • Cost savings £100M – £200M; revenue uplift £300M – £500M
06

AI transformation roadmap: five phases

Phase 1 (0–6 months) — Diagnose and stabilise: AI-driven demand forecasting, cost and cash controls, inventory and pricing rationalisation, data and asset audit.

Phase 2 (6–12 months) — Rebuild and optimise: AI-powered pricing and margin engine, dynamic inventory allocation, customer data foundation, process automation.

Phase 3 (12–18 months) — Scale and innovate: personalised customer journeys, AI content and listing optimisation, marketplace and partner integration, predictive remarketing.

Phase 4 (18–36 months) — Expand and monetise: new revenue streams across financing, warranty and subscriptions, international expansion, licensed technology and platform partnerships.

Phase 5 (36+ months) — Lead the future: an AI-native operating model, category leadership and brand authority, global brand and community, long-term value compounding.

Success factors: strong leadership and vision, a lean cost structure, a data-driven culture, customer trust and experience, and a technology-first mindset. Key enablers: a modern tech stack, AI and machine learning, data and analytics, a partnership ecosystem and an agile operating model. Next steps: validate assets and business case, secure funding and partnerships, launch pilot programmes, scale and integrate, and measure impact and iterate.
Mispriced today. Reimagined tomorrow. Rebuilt for generations.

The Multiplier Framework

7 compounding levers

Seven AI multipliers rebuilding the platform on lean unit economics — aggregating to £100M – £200M of annual cost savings, £300M – £500M of revenue uplift and £4.0BN+ of enterprise value potential by year five.

01

Dynamic Pricing & Margin Engine

Recover margin lost to static pricing against volatile residual values.

  • AI price elasticity and residual value modelling
  • Vehicle-level dynamic pricing
  • Competitor and wholesale index monitoring

Outcome · £100M – £200M margin uplift

02

Inventory & Reconditioning Intelligence

Compress days-to-sale and cut financing drag.

  • AI demand forecasting by model, spec and region
  • Dynamic inventory allocation across sites
  • Reconditioning throughput and prioritisation

Outcome · £80M – £150M per year

03

Acquisition Cost Optimisation

Lower cost per acquired customer against gross profit per unit.

  • AI media mix and attribution modelling
  • Predictive lead scoring and targeting
  • Lifecycle remarketing to the 7M customer base

Outcome · £60M – £120M per year

04

Logistics & Delivery Optimisation

Turn a nationwide delivery network from cost anchor to moat.

  • Route density and load optimisation
  • Collection and delivery scheduling AI
  • Regional hub capacity planning

Outcome · £50M – £100M per year

05

Listing & Discovery Optimisation

Higher conversion on a high-consideration, specification-heavy purchase.

  • AI content and listing generation
  • Semantic search and guided vehicle matching
  • Personalised journeys across the funnel

Outcome · £40M – £80M per year

06

Financing, Warranty & Risk

Monetise adjacent revenue with disciplined risk pricing.

  • AI credit and affordability scoring
  • Warranty and service plan attachment modelling
  • Fraud and misrepresentation detection

Outcome · £40M – £90M per year

07

Data & Decision Intelligence

Run the platform on evidence, not instinct.

  • Unified data platform across sourcing, sales and service
  • Executive dashboards and anomaly detection
  • Scenario modelling on residuals and demand

Outcome · £30M – £70M per year

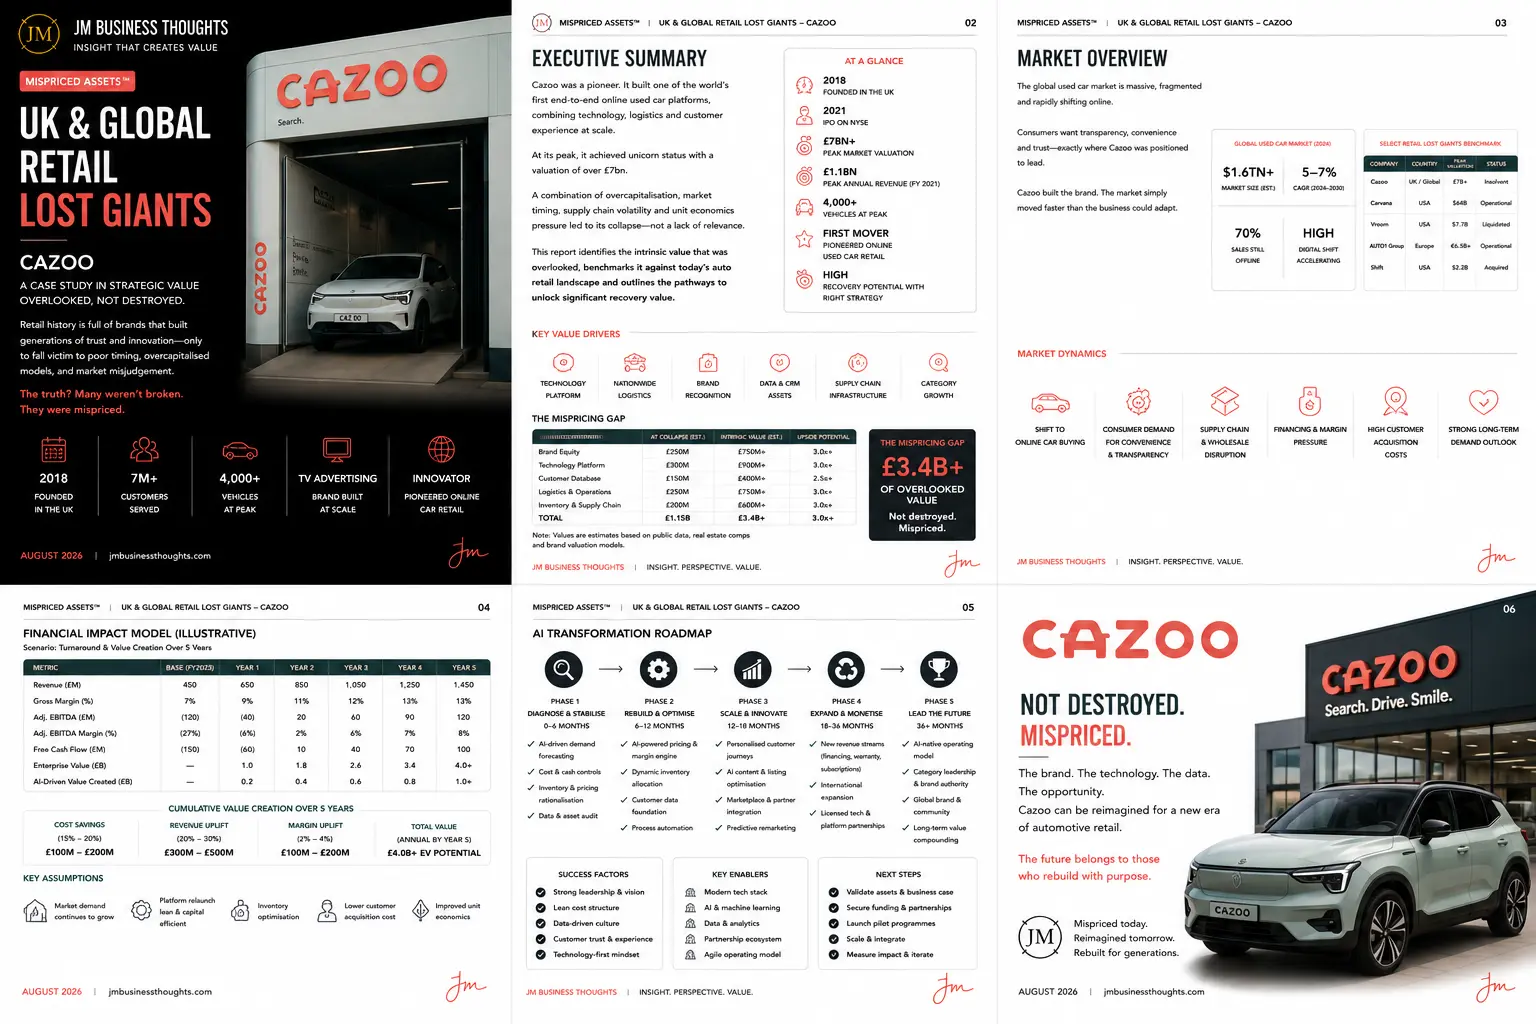
Cazoo: The Value Wasn’t Lost. It Was Mispriced. full strategic breakdown
Mispriced Assets™ · UK & Global Retail Lost Giants — Cazoo: the full six-page institutional report covering the cover and key value drivers, executive summary with the at-a-glance estate and the mispricing gap table, global used car market overview and lost giants benchmark, the five-year financial impact model with key assumptions, the five-phase AI transformation roadmap, and the closing reimagination case.

The Verdict

A 2018 pioneer with a £7BN+ peak valuation, £1.1BN of revenue, 7M+ customers and a fully built end-to-end platform — written to £1.15BN in insolvency against £4.3BN+ of intrinsic component value. The £3.4BN+ gap is the mispricing. Seventy percent of a $1.6TN market is still offline and Carvana trades at $64BN, so the thesis was never the problem — the capital structure was. Rebuilt lean on AI pricing, inventory, acquisition and logistics, the same assets support £1.45BN of revenue and £4.0BN+ of enterprise value. The future belongs to those who rebuild with purpose.

JM founder signature
68 · PureGym — Fitness At Scale. More Personal. More Inclusive.67 · SIXT — Smarter Mobility. Greater Availability. A More Connected Tomorrow.66 · Sendwave — Money That Moves With Intelligence.65 · McDonald’s — Serving The Future With AI.64 · Compare the Market — Smarter Comparison. Better Matches. Brighter Tomorrows.63 · WeBuyAnyCar — Smarter Pricing. Faster Offers. Better Conversion.62 · Primark — Affordable Fashion. Greater Possibilities With AI.61 · Starbucks — Smarter Stores. Stronger Loyalty. Better Margins.60 · IKEA — AI-Powered Home Retail at Global Scale59 · H&M — Smarter Fashion. Brighter Tomorrow.58 · WeWork — The Value Wasn't Lost. It Was Mispriced.57 · Yahoo — The Value Wasn't Lost. It Was Mispriced.56 · Nando's UK — Smarter Restaurants. Stronger Loyalty. Better Margins.55 · The Amplifier54 · The Body Shop53 · Arcadia Group50 · Carpetright49 · Wilko48 · Mothercare47 · Phones 4u46 · Farfetch45 · Jumia44 · Toys ‘R’ Us43 · The Collateral Gap — Part One41 · The Amplifier40 · Africa Bee Farming39 · Kenya Airways38 · Africa Greenhouse Farming37 · Uganda Tourism Board36 · Boots UK35 · Biffa (UK)34 · NatWest33 · Skip Hire Companies UK33 · The Audit32 · The Lean Company31 · Africa Mushroom Farming29 · The Rider Economy Nobody Verified28 · The Layer Underneath the Layer27 · Independent Timber Yards & Jewson Timber26 · Link Up TV & GRM Daily25 · East African Portland Cement42 · International Student Credential & Financial Verification — Part One24 · The Supply Chain Inside the Supply Chain23 · The White Space, Mapped22 · The Real Opportunity21 · Greencore20 · West Ham United19 · Roofings Group Uganda18 · Mombasa Port17 · Auto Trader UK16 · Uganda Coffee Development Authority15 · Brookside Dairy14 · GraceKennedy13 · Rightmove12 · Manchester United11 · Greggs30 · Twiga Foods10 · Uchumi09 · Konga08 · Edcon09 · GAME07 · Debenhams06 · Claire's05 · Boohoo04 · Argos