01
Route Optimisation
£30M – £60M / year
- AI routing with traffic prediction and stop sequencing
- Reduce miles, fuel and driver time
- Raise drops per vehicle per day without adding fleet
Outcome · Route density index from 100 to 150
The Hidden AI Operating System Audit Series™
Where AI creates new profit pools—not just productivity.
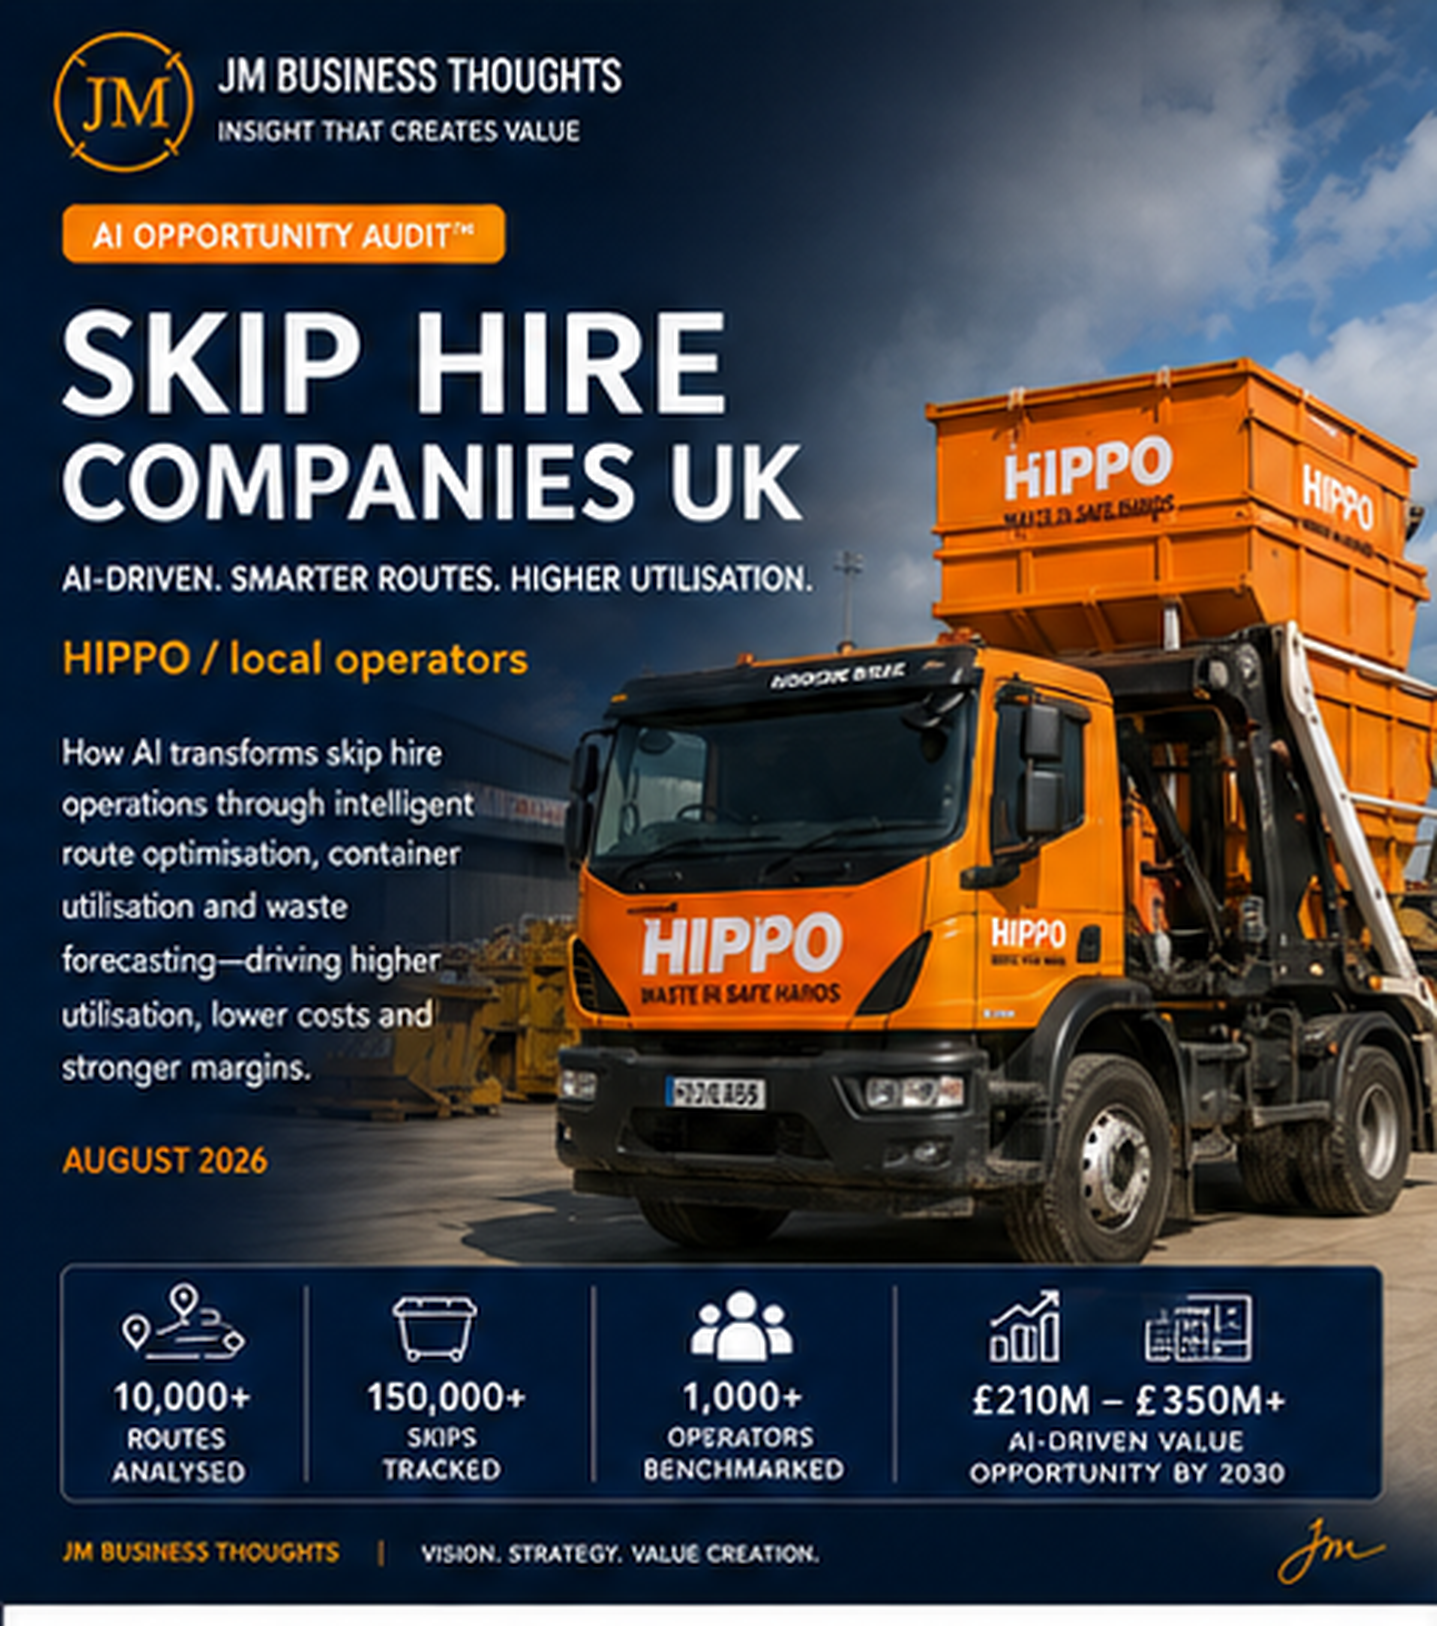
An AI Opportunity Audit™ across the UK skip hire market — HIPPO and thousands of local operators — mapping route optimisation, container utilisation, waste forecasting, dynamic pricing and predictive maintenance to a £210M – £350M+ annual value opportunity by 2030.
Skip Moves / Year
80M+
Skips In Active Use
20,000+
UK Skip Hire Market (Est.)
£2.5BN+
Digital / AI Adoption (CAGR)
2–4%
Potential Cost Reduction
20–35%
Routes Analysed
10,000+
Operators Benchmarked
1,000+
Annual AI Value By 2030
£210M – £350M+
The Thesis
The UK skip hire market is a £2.5BN+ logistics business that has never been run as one. Eighty per cent of it is served by local operators planning routes manually, pricing by habit and leaving containers idle for the majority of their asset life. HIPPO leads nationally with roughly 20% share. Digital and AI adoption across the industry sits at 2–4%. This is not a technology gap — it is a margin gap. Route density, container turn and pricing precision are the three variables that decide profitability, and all three are solvable with AI today. The prize is £210M – £350M+ of annual value by 2030 and a consolidation window for whoever builds the operating layer first.
Exhibit · Report Cover
33 · AI Opportunity Audit™
The UK skip hire market is competitive and highly fragmented, with HIPPO as the leading national player and thousands of local operators delivering critical waste management services. Roughly 80% of the market is served by local operators; HIPPO holds about 20%.
AI technologies can drive step-change improvements in route efficiency, container utilisation, pricing precision and operational automation — unlocking significant financial value and customer satisfaction gains.
By leveraging AI across planning, pricing, dispatch and maintenance, HIPPO and local operators can reduce cost by 20–35%, increase utilisation and build sustainable competitive advantage in a market where scale currently confers surprisingly little operating leverage.
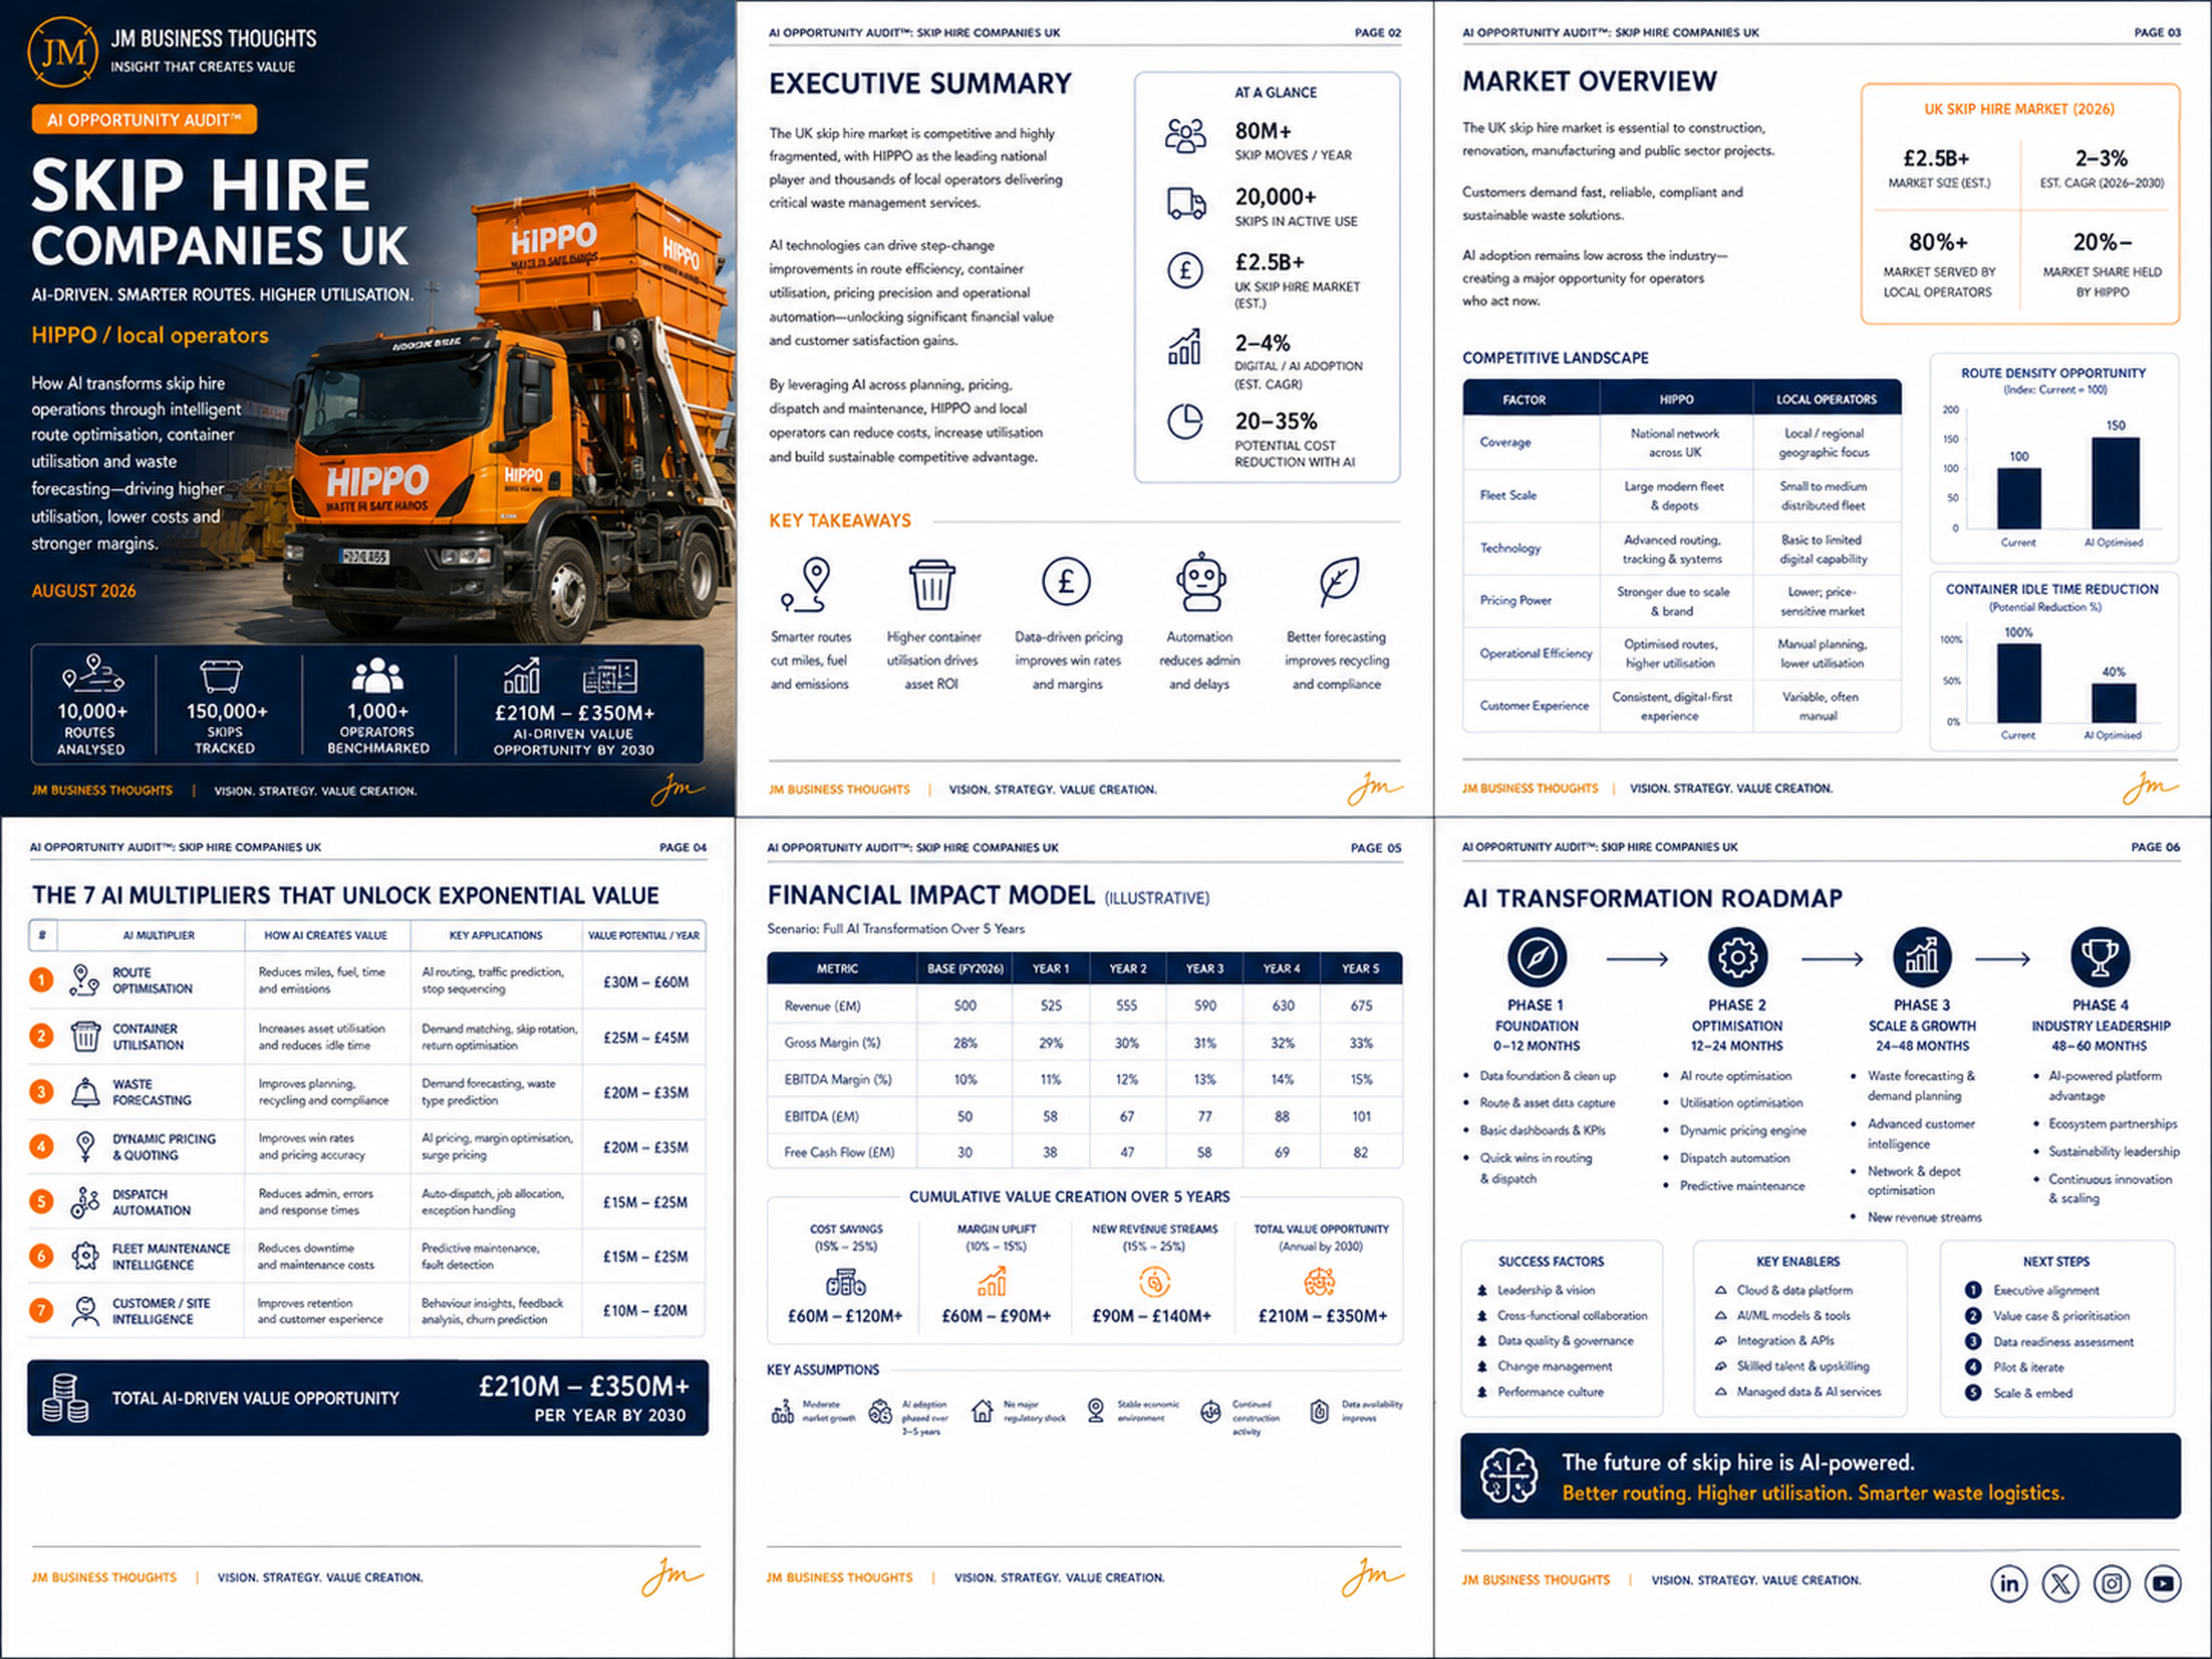
80% of a £2.5BN+ market is served by operators with 2–4% digital adoption.
The UK skip hire market is essential to construction, renovation, manufacturing and public sector activity. Market size is estimated at £2.5BN+ in 2026, growing at 2–3% CAGR through 2030 — steady, non-cyclical enough to finance, and largely insulated from substitution.
Customers demand fast, reliable, compliant and sustainable waste solutions. Increasingly they demand evidence: waste transfer documentation, recycling rates and carbon reporting that most local operators cannot produce.
AI adoption remains low across the industry — creating a major opportunity for operators who act now. Route density modelling suggests an index improvement from 100 to 150 for an AI-optimised network, while container idle time can fall from 100% baseline to 40% of current levels.
Route density index: 100 today, 150 AI-optimised. Container idle time: down to 40%.
Skip hire economics are decided by three ratios: miles per skip move, turns per container per year, and price realised against quoted. Everything else — depot cost, admin, marketing — is secondary.
Manual route planning typically produces 15–25% more miles than an optimised plan for identical demand. Every additional mile carries fuel, driver time, vehicle wear and an emissions cost that is now contractually relevant on public sector work.
Container idle time is the most expensive invisible cost in the industry. A skip sitting on a driveway waiting for an exchange, or in a yard waiting for demand, earns nothing while depreciating. Demand matching and skip rotation modelling attack this directly — and it is where operators find utilisation gains fastest.
The illustrative model runs a full AI transformation over five years for a national-scale operator. Revenue moves from £500M in the FY2026 base to £675M by Year 5. Gross margin lifts from 28% to 33% and EBITDA margin from 10% to 15%.
EBITDA moves from £50M to £101M — roughly a doubling — while free cash flow moves from £30M to £82M as fleet utilisation improves and maintenance shifts from reactive to predictive.
Cumulative value creation over five years splits into cost savings of £60M – £120M+ (15–25%), margin uplift of £60M – £90M+ (10–15%) and new revenue streams of £90M – £140M+ (15–25%) — a total annual value opportunity of £210M – £350M+ by 2030.
£210M – £350M+ total AI-driven value opportunity per year by 2030.
The model assumes moderate market growth, AI adoption phased over three to five years, no major regulatory shock, a stable economic environment, continued construction activity and improving data availability.
The principal downside risks are construction cycle exposure, driver availability and fuel price volatility. Landfill tax and permitting changes can move waste stream economics quickly — which argues for forecasting capability rather than against investment.
The principal upside risk is consolidation. In a market where 80% of volume is fragmented, an operator with a demonstrably lower cost-to-serve can acquire competitors at multiples that its own operating layer immediately re-rates.
Phase 1 (0–12 months) is foundation: data foundation and clean-up, route and asset data capture, basic dashboards and KPIs, and quick wins in routing and dispatch.
Phase 2 (12–24 months) is optimisation: AI route optimisation, utilisation optimisation, a dynamic pricing engine, dispatch automation and predictive maintenance. Phase 3 (24–48 months) is scale and growth: waste forecasting and demand planning, advanced customer intelligence, network and depot optimisation and new revenue streams.
Phase 4 (48–60 months) is industry leadership: an AI-powered platform advantage, ecosystem partnerships, sustainability leadership and continuous innovation and scaling.
The Multiplier Framework
Seven AI multipliers unlock exponential value across the UK skip hire value chain — sized to £210M – £350M+ per year by 2030.
£30M – £60M / year
Outcome · Route density index from 100 to 150
£25M – £45M / year
Outcome · Container idle time reduced to 40% of current levels
£20M – £35M / year
Outcome · Compliance evidence becomes a commercial asset
£20M – £35M / year
Outcome · Margin recovered without losing volume
£15M – £25M / year
Outcome · Same team, materially more jobs handled
£15M – £25M / year
Outcome · Vehicles on the road instead of in the yard
£10M – £20M / year
Outcome · Retention economics in a market that assumes churn
The Verdict
The future of skip hire is AI-powered. Better routing. Higher utilisation. Smarter waste logistics. For HIPPO and the local operators willing to build the control layer, that is £210M – £350M+ of annual value by 2030 — and the consolidation option that comes with it.