Toys ‘R’ Us: The Value Wasn’t Lost. It Was Mispriced. research poster
All Research
44Mispriced Assets™ 21 min readAugust 2026
Coverage · United Kingdom · United States · GlobalSector · Retail · Toys & Play · Brand IP · Real EstateFormat · Six-page audit

Toys ‘R’ UsUK & Global Retail Lost Giants

Toys “R” Us collapsed in 2017 carrying $11.6BN of peak revenue, ~1,600 stores and 70M+ annual customers into liquidation. Demand for toys never fell. What failed was the operating model, the capital structure and the customer experience — three fixable things. This audit separates the assets that were destroyed from the assets that were simply written off at the wrong price, and sizes the recovery at $13BN+.

Overlooked Value

$13B+

Peak Annual Revenue (2017)

$11.6B

Stores Globally At Peak

~1,600

Countries At Peak

70+

Customers Annually At Peak

70M+

Brand Value Pre-Failure (Est.)

$5.3B

Real Estate Value (Est.)

$7B+

Recovery Potential

20 – 40%

The Thesis

The 2017 collapse is remembered as a demand story. It was a balance-sheet and operating-model story. The global toy market is worth $120BN+ and still compounding at 4–5%; parents influence 80%+ of purchase decisions; licensed IP and experiential retail have grown, not shrunk. Toys “R” Us lost share, not relevance. At collapse the estate was marked at roughly $1.3BN across brand, property, customer data, licences and digital assets. Benchmarked against comparable brand, property and data valuations, the intrinsic estate sits nearer $9BN — a 7x mispricing, rising to $13BN+ of realistic recovery once AI-native operating leverage is applied on top. The asset was not broken. It was liquidated at the wrong number by owners who needed cash faster than they needed value.

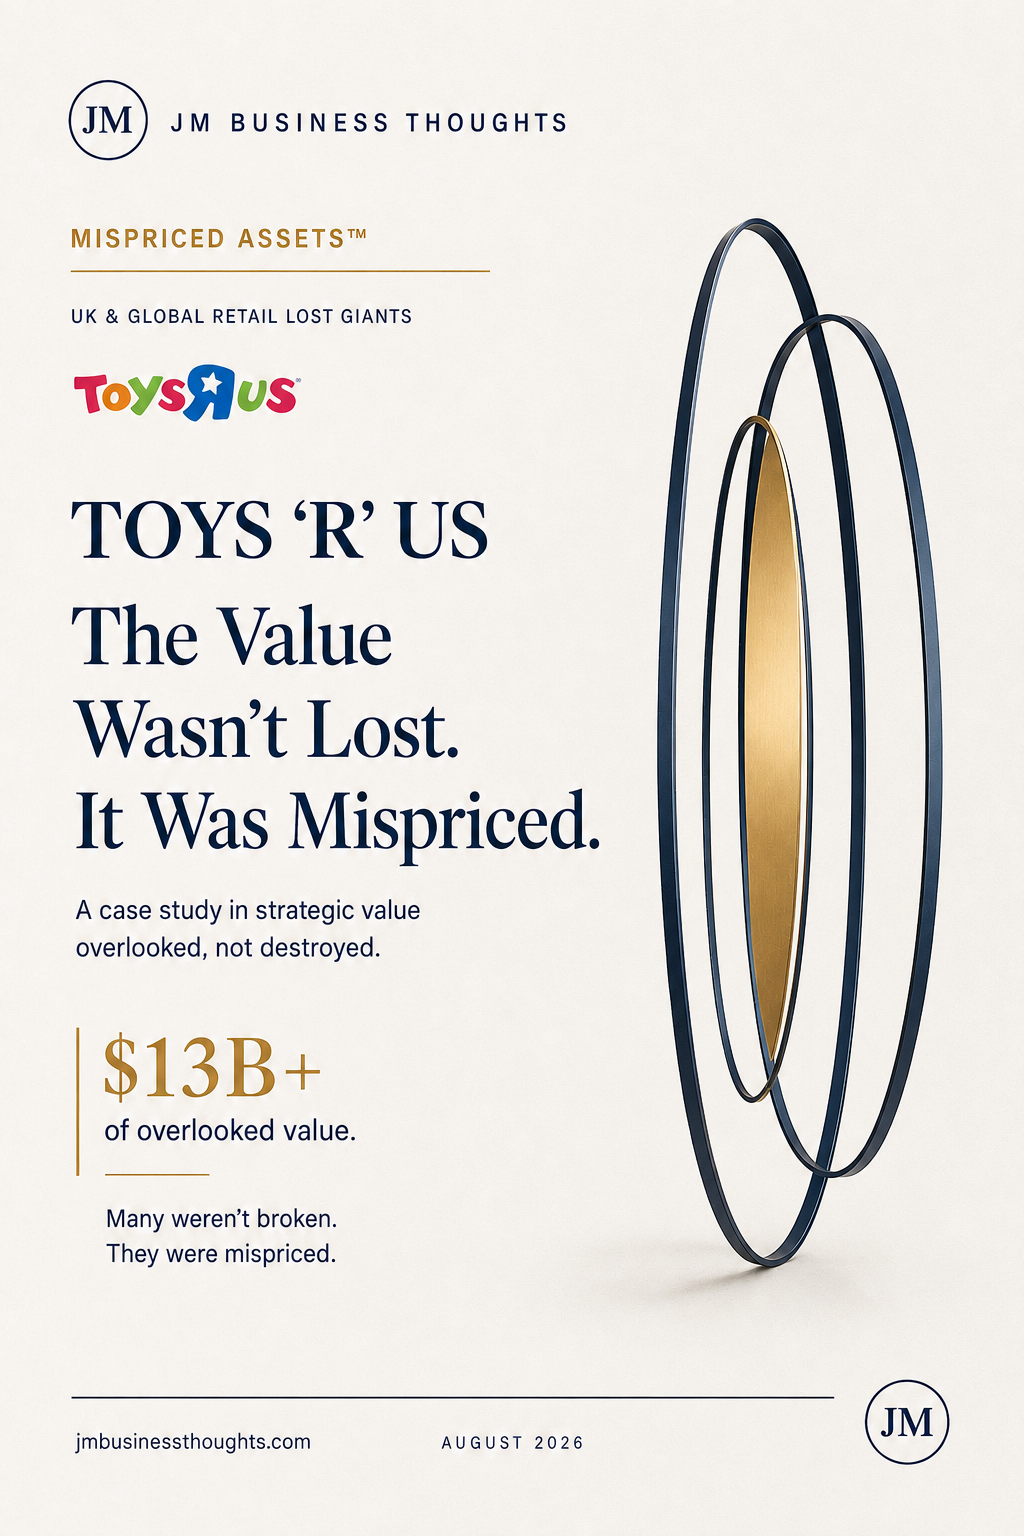
Exhibit · Report Cover

44 · Mispriced Assets™

Toys ‘R’ Us: The Value Wasn’t Lost. It Was Mispriced. report cover
Toys ‘R’ Us: The Value Wasn’t Lost. It Was Mispriced.August 2026 · United Kingdom · United States · Global
01

What actually failed in 2017

Toys “R” Us entered its final year with $11.6BN of annual revenue, around 1,600 stores across more than 70 countries and over 70 million customers a year. Those are not the numbers of a business the market has abandoned. They are the numbers of a business that cannot service its debt.

The 2005 leveraged buyout loaded roughly $5BN of debt onto a retailer whose category was moving online. Interest consumed the capital that should have funded e-commerce, store refurbishment, data infrastructure and own-brand development. Competitors reinvested; Toys “R” Us paid coupons. By the time the digital gap was visible in the numbers, the balance sheet had no capacity to close it.

The operating model compounded the problem. Big-box stores in prime locations were run as warehouses rather than experiences, at a moment when the toy category was shifting decisively toward discovery, play and content. Physical retail did not stop mattering — 80%+ of toy purchases are still parent-influenced and a large share of discovery still happens in-store. What stopped mattering was undifferentiated shelf space.

The distinction matters commercially. A demand failure is terminal; an operating and capital failure is recoverable. Every asset audited below survived the liquidation intact and was sold, licensed or abandoned at a fraction of comparable market value.

$11.6BN of revenue and 70 million customers. This was not a demand failure.
  • $11.6B peak annual revenue (2017); ~1,600 stores; 70+ countries; 70M+ customers annually
  • ~$5BN of LBO debt from 2005 absorbed the capital that should have funded digital
  • Category never contracted: global toy market $120BN+, compounding 4–5% (2024–2030)
  • 80%+ of toy purchases carry direct parent purchase influence
02

The mispricing gap, asset by asset

The recovery case is not sentiment. It is a line-by-line comparison between what each asset class realised at collapse and what comparable assets trade for.

Brand equity was marked at roughly $0.3BN. Comparable heritage retail and character brands with equivalent multi-generational recognition sit at $2.0BN+, implying 6–8x upside. Geoffrey the Giraffe is one of a very small number of retail mascots with genuine cross-generational recall — the exact asset licensing markets now pay premium multiples for.

The real estate portfolio realised around $0.7BN against an estimated $4.0BN+ of intrinsic value: prime out-of-town and edge-of-city footprints that have since been re-rated for last-mile fulfilment, experiential retail and mixed-use redevelopment. That is 6x, and it is the single largest line in the gap.

The customer database realised $0.2BN against $1.5BN+ intrinsic — 70 million annual customer relationships with purchase history at the most predictable life-stage trigger in consumer retail. Licences and IP realised $0.1BN against $1.5BN+, a 10x gap in a decade when toy IP became content IP. Digital and data assets realised effectively nothing against $0.5BN+.

Aggregate: roughly $1.3BN realised against $9.0BN+ intrinsic. A 7x mispricing across five independent asset classes is not a valuation error in one line. It is a structural feature of distressed liquidation, where speed of sale is worth more to the seller than value of sale.

$1.3BN realised. $9.0BN+ intrinsic. A 7x gap across five independent asset classes.
  • Brand equity — $0.3B at collapse vs $2.0B+ intrinsic (6–8x)
  • Real estate portfolio — $0.7B vs $4.0B+ (6x)
  • Customer database — $0.2B vs $1.5B+ (7x)
  • Licences & IP — $0.1B vs $1.5B+ (10x+)
  • Digital & data assets — ~$0.0B vs $0.5B+ (10x+)
  • Total — $1.3B vs $9.0B+ intrinsic, before AI-driven operating leverage
03

The market it left behind kept growing

The global toy market is estimated at $120BN+ and forecast to compound at 4–5% through 2030, driven by population growth, premiumisation and the shift toward experiential and collectible play. None of those drivers existed in weaker form in 2017; all of them are stronger now.

Four dynamics define the current market. E-commerce acceleration has favoured direct-to-consumer toy brands with owned demand. Experience matters more, not less: physical stores still drive discovery, and the winning formats are play-led rather than shelf-led. Licensed IP power has increased as film, streaming and gaming content drive demand cycles. And a consolidation wave has opened room for strong comeback players to acquire scale cheaply.

Benchmarked against the wider lost-giants cohort, Toys “R” Us screens at the top of the recovery table. Blockbuster ($5.9BN peak) is defunct with medium niche potential. Borders ($4.3BN) liquidated, medium niche. Maplin (£1.0BN) collapsed, medium. Debenhams (£1.6BN) liquidated, medium. HMV (£0.6BN) restructured, high. Toys “R” Us is the only name in that set combining an $11.6BN revenue base, a globally recognised brand and a growing rather than structurally declining category.

That is the asymmetry. Most lost giants failed into shrinking markets. This one failed into a market that has grown roughly a third since.

It lost share, not relevance. The category grew while the operator disappeared.
  • $120B+ global toy market (2024), 4–5% CAGR to 2030
  • Four dynamics: e-commerce acceleration, experience-led retail, licensed IP power, consolidation
  • Benchmark cohort: Blockbuster, Borders, Maplin, Debenhams, HMV — all smaller, most in declining categories
  • Toys “R” Us screens highest for recovery potential across the lost-giants set
04

Sizing the AI-driven recovery: $13BN+

The $9BN intrinsic estate is the static case. The dynamic case adds what an AI-native operator can extract from the same assets that a 2017 operator could not.

Brand revival contributes £3BN–£5BN of value potential through story-led marketing, heritage campaigns and community reactivation across two customer generations. Omnichannel integration adds £2BN–£3BN by unifying commerce, app, subscription and CRM into one demand system rather than three disconnected ones. Licences and IP monetisation adds £1BN–£2BN as the brand moves into film, gaming, streaming and content collaboration.

Real estate optimisation contributes £3BN–£5BN through lease, sale, redevelopment and repurposing of prime locations. Private label and exclusives add £1BN–£2BN at structurally higher margin. Data and customer intelligence adds £1BN–£2BN via personalised offers, loyalty and lifetime-value extension. Operational excellence adds a further £1BN–£2BN through automation, demand forecasting and vendor optimisation.

Aggregate AI-driven value opportunity: £13BN+ of realistic recovery potential, sitting on a recovery probability band of 20–40% depending on execution quality and capital discipline. The critical point is that these are not seven independent bets. Data intelligence prices the private label range; omnichannel supplies the data; brand revival fills the omnichannel funnel; real estate monetisation funds the whole programme.

Against that, the entry cost is the point. The assets were marked at $1.3BN. The recovery pool is an order of magnitude above it.

£13BN+ of AI-driven value on an estate the market marked at $1.3BN.
  • Brand revival £3B–£5B; real estate optimisation £3B–£5B
  • Omnichannel integration £2B–£3B; licences & IP £1B–£2B
  • Private label £1B–£2B; data & customer intelligence £1B–£2B; operational excellence £1B–£2B
  • Total £13B+ realistic recovery potential; 20–40% recovery probability band
05

The five-year financial impact model

Modelled from a zero base at FY2024 under a turnaround-and-value-creation scenario, the trajectory is deliberately unheroic in year one and compounding thereafter.

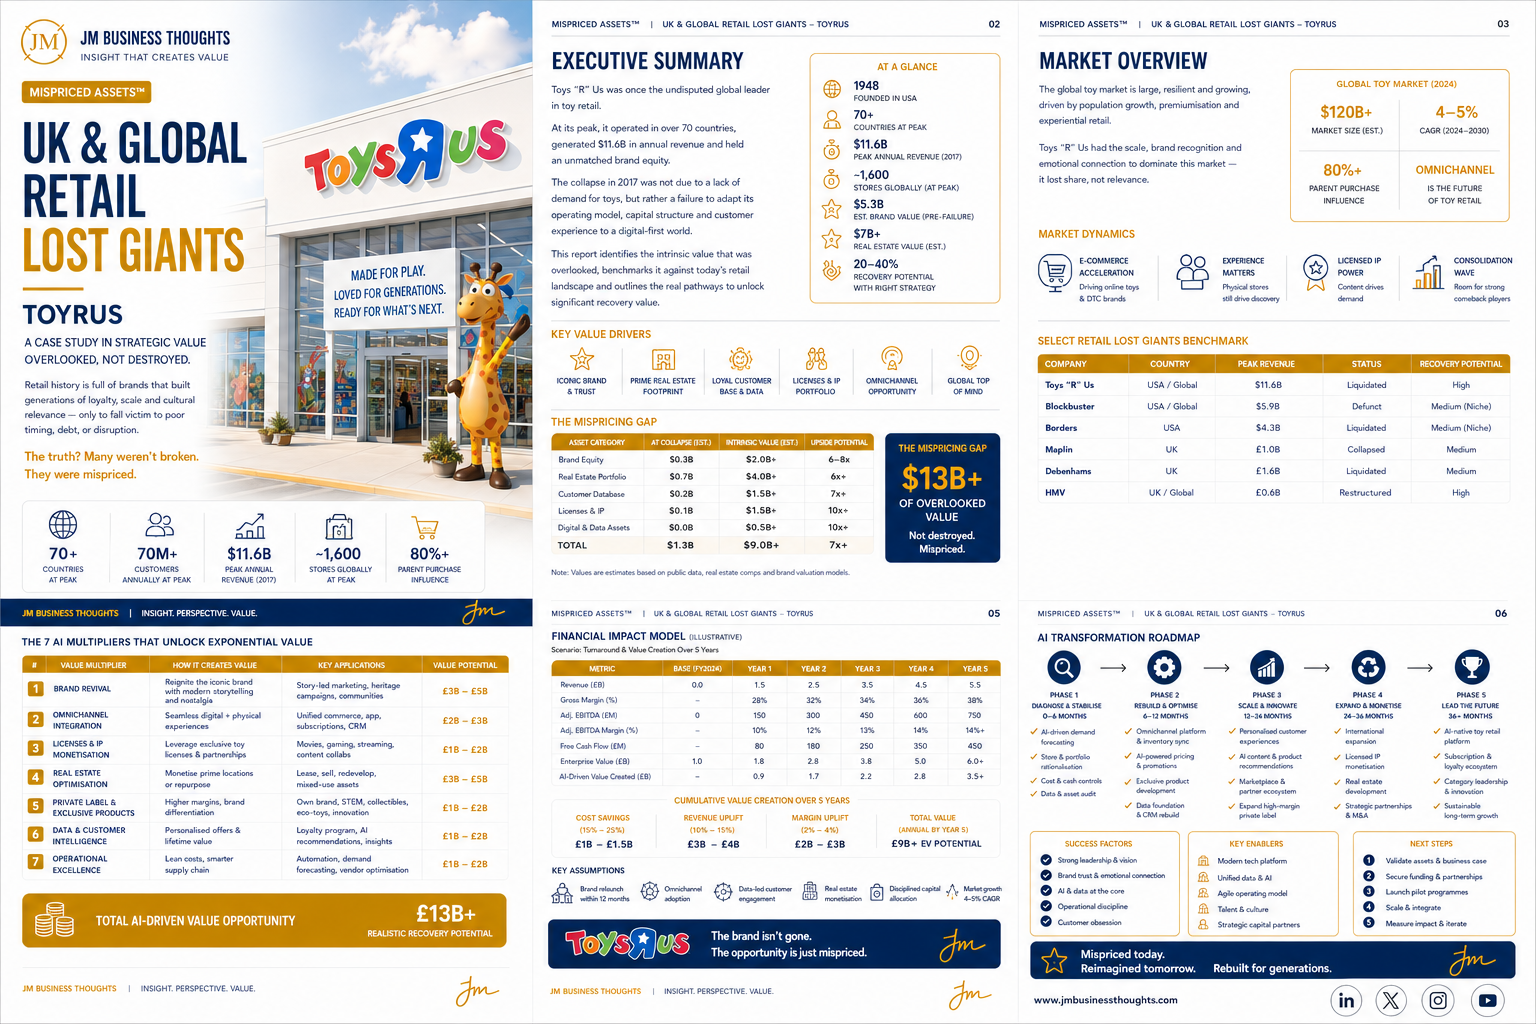
Revenue moves £1.5BN in Year 1, £2.5BN in Year 2, £3.5BN in Year 3, £4.5BN in Year 4 and £5.5BN in Year 5. Gross margin expands from 28% to 32%, 34%, 36% and 38% as private label penetration, pricing intelligence and vendor optimisation take hold — a ten-point margin move that accounts for the majority of the enterprise value created.

Adjusted EBITDA runs £150M, £300M, £450M, £600M and £750M across the five years, holding margin at 10%, 12%, 13%, 14% and 14%+. Free cash flow follows at £80M, £180M, £250M, £350M and £450M — sufficient to self-fund the back half of the programme from Year 3 without further equity.

Enterprise value moves from a 1.0 base to 1.8x, 2.8x, 3.8x, 5.0x and 6.0x+, with AI-driven value created contributing 0.9, 1.7, 2.2, 2.8 and 3.5x of that. Cumulative value creation across the period: £1BN–£1.5BN from cost savings (15–25%), £3BN–£4BN from revenue uplift (10–15%), £2BN–£3BN from margin uplift (2–4%) — £9BN+ of annual enterprise-value potential by Year 5.

Four assumptions carry the model: brand relaunch inside twelve months, omnichannel adoption at the assumed rate, data-led customer engagement reaching the modelled personalisation lift, real estate monetised rather than merely held, and disciplined capital allocation against 4–5% category growth. Weaken any one and the model degrades gracefully; weaken capital discipline and it fails exactly as 2017 did.
£5.5BN of revenue at 38% gross margin by Year 5 — from a standing start.
  • Revenue £1.5B → £5.5B; gross margin 28% → 38% over five years
  • Adj. EBITDA £150M → £750M; free cash flow £80M → £450M
  • Enterprise value 1.8x → 6.0x+; AI-driven value created 0.9 → 3.5x
  • Cumulative: £1B–£1.5B cost savings, £3B–£4B revenue uplift, £2B–£3B margin uplift
  • £9B+ annual enterprise value potential by Year 5 (illustrative, not a forecast)
06

The five-phase transformation roadmap

Phase 1 (0–6 months) diagnoses and stabilises: AI-driven demand forecasting, store and portfolio rationalisation, cost and cash controls, and a full data and asset audit. Nothing is relaunched before the asset register is verified — the single most common failure in retail turnarounds is scaling a proposition the data does not support.

Phase 2 (6–12 months) rebuilds and optimises: omnichannel platform and inventory sync, AI-powered pricing and promotions, exclusive product development, and the data foundation and CRM rebuild that every later phase depends on.

Phase 3 (12–24 months) scales and innovates: personalised customer experiences, AI content and product recommendations, a marketplace and partner ecosystem, and expansion of the high-margin private label range.

Phase 4 (24–36 months) expands and monetises: international expansion, licensed IP monetisation, real estate development, and strategic partnerships and M&A into the consolidation wave. Phase 5 (36+ months) leads the future: AI-native toy retail, subscription and loyalty ecosystems, category leadership and innovation, and sustainable long-term growth.

Five success factors govern the whole sequence: strong leadership and vision, brand trust and emotional connection, AI and data at the core rather than bolted on, operational discipline, and customer obsession. Five enablers make it executable: a modern technology platform, unified data and AI, an agile operating model, talent and culture, and strategic capital partners — the last of which is where 2017 failed.

Verify the asset register before relaunching the brand. Every turnaround that skips this fails.
  • Phase 1 (0–6m) — diagnose & stabilise: forecasting, portfolio rationalisation, cash control, data audit
  • Phase 2 (6–12m) — rebuild & optimise: omnichannel, AI pricing, exclusives, CRM rebuild
  • Phase 3 (12–24m) — scale & innovate: personalisation, marketplace, private label
  • Phase 4 (24–36m) — expand & monetise: international, IP, real estate, M&A
  • Phase 5 (36m+) — lead: AI-native retail, subscription and loyalty, category leadership
07

Governance, assumptions and what would break the thesis

All valuations here are estimates built on public data, real estate comparables and brand valuation models. They are recovery-potential ranges under stated assumptions, not forecasts, and not investment advice. The recovery band is explicitly 20–40% — meaning the base case is that most of the identified value is not captured by any single operator.

Three things would break the thesis. First, capital structure repetition: any acquirer that re-leverages the estate to fund the relaunch recreates the exact 2005 failure mechanism, and the model's Year 3 self-funding assumption is what prevents it. Second, brand decay: multi-generational recall has a half-life, and each year outside the market erodes the £3BN–£5BN brand revival line. Third, licensing lock-out — if the major toy IP holders consolidate exclusive distribution with existing incumbents, the £1BN–£2BN IP monetisation line closes.

The honest reading is that the mispricing is documented and the recovery is conditional. Five asset classes were sold at roughly a seventh of comparable value into a growing category by a seller optimising for speed. That is the definition of a mispriced asset. Whether it is realised depends on execution, and execution here means capital discipline first and brand romance second.

Next in the Mispriced Assets™ series: the same four-part test applied across the wider UK and global retail lost-giants cohort — Blockbuster, Borders, Maplin, Debenhams and HMV — audited individually against category direction, brand half-life, asset recoverability and capital structure. Never averaged.

Mispriced today. Reimagined tomorrow. Rebuilt for generations.
  • Valuations are estimates from public data, real estate comps and brand valuation models
  • Break risks: re-leveraging the estate, brand recall decay, licensing lock-out
  • Recovery band 20–40% — the base case is partial capture, not full capture
  • Next steps: validate assets, secure funding and partnerships, launch pilots, scale, measure

The Multiplier Framework

7 compounding levers

Seven value multipliers convert a $1.3BN liquidated estate into a £13BN+ recovery pool. Each has a live comparable in today's toy market, and each compounds the others: data prices the range, omnichannel supplies the data, brand fills the funnel, and property funds the programme.

01

Brand Revival

Reignite the iconic brand with modern storytelling and nostalgia

  • Story-led marketing across two customer generations
  • Heritage campaigns anchored on Geoffrey and multi-generational recall
  • Community and creator programmes to rebuild owned demand
  • Reposition from shelf space to play culture

Outcome · £3BN–£5BN of value potential from brand equity alone

02

Omnichannel Integration

Seamless digital plus physical experiences

  • Unified commerce across store, app and marketplace
  • Real-time inventory sync and store-as-fulfilment
  • Subscription mechanics for repeat, low-effort purchase
  • One CRM spine rather than three disconnected demand systems

Outcome · £2BN–£3BN of value potential from a single unified demand system

03

Licences & IP Monetisation

Leverage exclusive toy licences and partnerships

  • Movies, gaming, streaming and content collaborations
  • Own-IP development around the mascot and heritage catalogue
  • Exclusive windows with major toy IP holders
  • Licensing the brand into adjacent play and experience categories

Outcome · £1BN–£2BN of value potential — a 10x+ gap against the collapse mark

04

Real Estate Optimisation

Monetise prime locations or repurpose them

  • Lease, sell or redevelop the prime out-of-town footprint
  • Convert selected sites to last-mile fulfilment nodes
  • Mixed-use redevelopment on high-value edge-of-city assets
  • Fund the transformation programme from property, not from debt

Outcome · £3BN–£5BN of value potential; the single largest line in the gap

05

Private Label & Exclusive Products

Higher margins, brand differentiation

  • Own-brand ranges across STEM, collectibles and eco-toys
  • Exclusive product development with manufacturing partners
  • AI-led range planning against observed demand, not buyer instinct
  • Innovation pipeline priced off customer data

Outcome · £1BN–£2BN of value potential and the core of the 28%→38% margin move

06

Data & Customer Intelligence

Personalised offers and lifetime value

  • Reactivate the 70M+ customer relationship base with purchase history
  • AI recommendations at the life-stage trigger points that define the category
  • Loyalty programmes priced on lifetime value, not discount depth
  • Insight loops feeding range, pricing and content decisions

Outcome · £1BN–£2BN of value potential from an asset written off at $0.2BN

07

Operational Excellence

Lean costs, smarter supply chain

  • AI demand forecasting across seasonal and licensed peaks
  • Automation across warehousing, replenishment and store labour
  • Vendor optimisation and landed-cost intelligence
  • Cash and working capital discipline as a permanent control

Outcome · £1BN–£2BN of value potential and 15–25% of addressable cost removed

Toys ‘R’ Us: The Value Wasn’t Lost. It Was Mispriced. full strategic breakdown
Mispriced Assets™ · UK & Global Retail Lost Giants — Toys “R” Us: the full six-page institutional report covering the executive summary and at-a-glance metrics, market overview and lost-giants benchmark, the mispricing gap by asset class, the seven value multipliers, the five-year financial impact model and the five-phase AI transformation roadmap.

The Verdict

Five asset classes — brand, property, customer data, licences and digital — were realised at roughly $1.3BN against $9.0BN+ of comparable intrinsic value, into a toy market that has grown to $120BN+ and continues compounding at 4–5%. Layer AI-native operating leverage on top and the recovery pool reaches £13BN+, with a 20–40% realistic capture band. The brand isn't gone. The demand didn't leave. The capital structure failed and the estate was cleared at speed rather than at value. Mispriced today. Reimagined tomorrow. Rebuilt for generations.

JM founder signature
68 · PureGym — Fitness At Scale. More Personal. More Inclusive.67 · SIXT — Smarter Mobility. Greater Availability. A More Connected Tomorrow.66 · Sendwave — Money That Moves With Intelligence.65 · McDonald’s — Serving The Future With AI.64 · Compare the Market — Smarter Comparison. Better Matches. Brighter Tomorrows.63 · WeBuyAnyCar — Smarter Pricing. Faster Offers. Better Conversion.62 · Primark — Affordable Fashion. Greater Possibilities With AI.61 · Starbucks — Smarter Stores. Stronger Loyalty. Better Margins.60 · IKEA — AI-Powered Home Retail at Global Scale59 · H&M — Smarter Fashion. Brighter Tomorrow.58 · WeWork — The Value Wasn't Lost. It Was Mispriced.57 · Yahoo — The Value Wasn't Lost. It Was Mispriced.56 · Nando's UK — Smarter Restaurants. Stronger Loyalty. Better Margins.55 · The Amplifier54 · The Body Shop53 · Arcadia Group52 · Cazoo51 · Blockbuster50 · Carpetright49 · Wilko48 · Mothercare47 · Phones 4u46 · Farfetch45 · Jumia41 · The Amplifier40 · Africa Bee Farming39 · Kenya Airways38 · Africa Greenhouse Farming37 · Uganda Tourism Board36 · Boots UK35 · Biffa (UK)34 · NatWest33 · Skip Hire Companies UK33 · The Audit32 · The Lean Company31 · Africa Mushroom Farming29 · The Rider Economy Nobody Verified28 · The Layer Underneath the Layer27 · Independent Timber Yards & Jewson Timber26 · Link Up TV & GRM Daily25 · East African Portland Cement42 · International Student Credential & Financial Verification — Part One24 · The Supply Chain Inside the Supply Chain23 · The White Space, Mapped22 · The Real Opportunity21 · Greencore20 · West Ham United19 · Roofings Group Uganda18 · Mombasa Port17 · Auto Trader UK16 · Uganda Coffee Development Authority15 · Brookside Dairy14 · GraceKennedy13 · Rightmove12 · Manchester United11 · Greggs30 · Twiga Foods10 · Uchumi09 · Konga08 · Edcon09 · GAME07 · Debenhams06 · Claire's05 · Boohoo04 · Argos