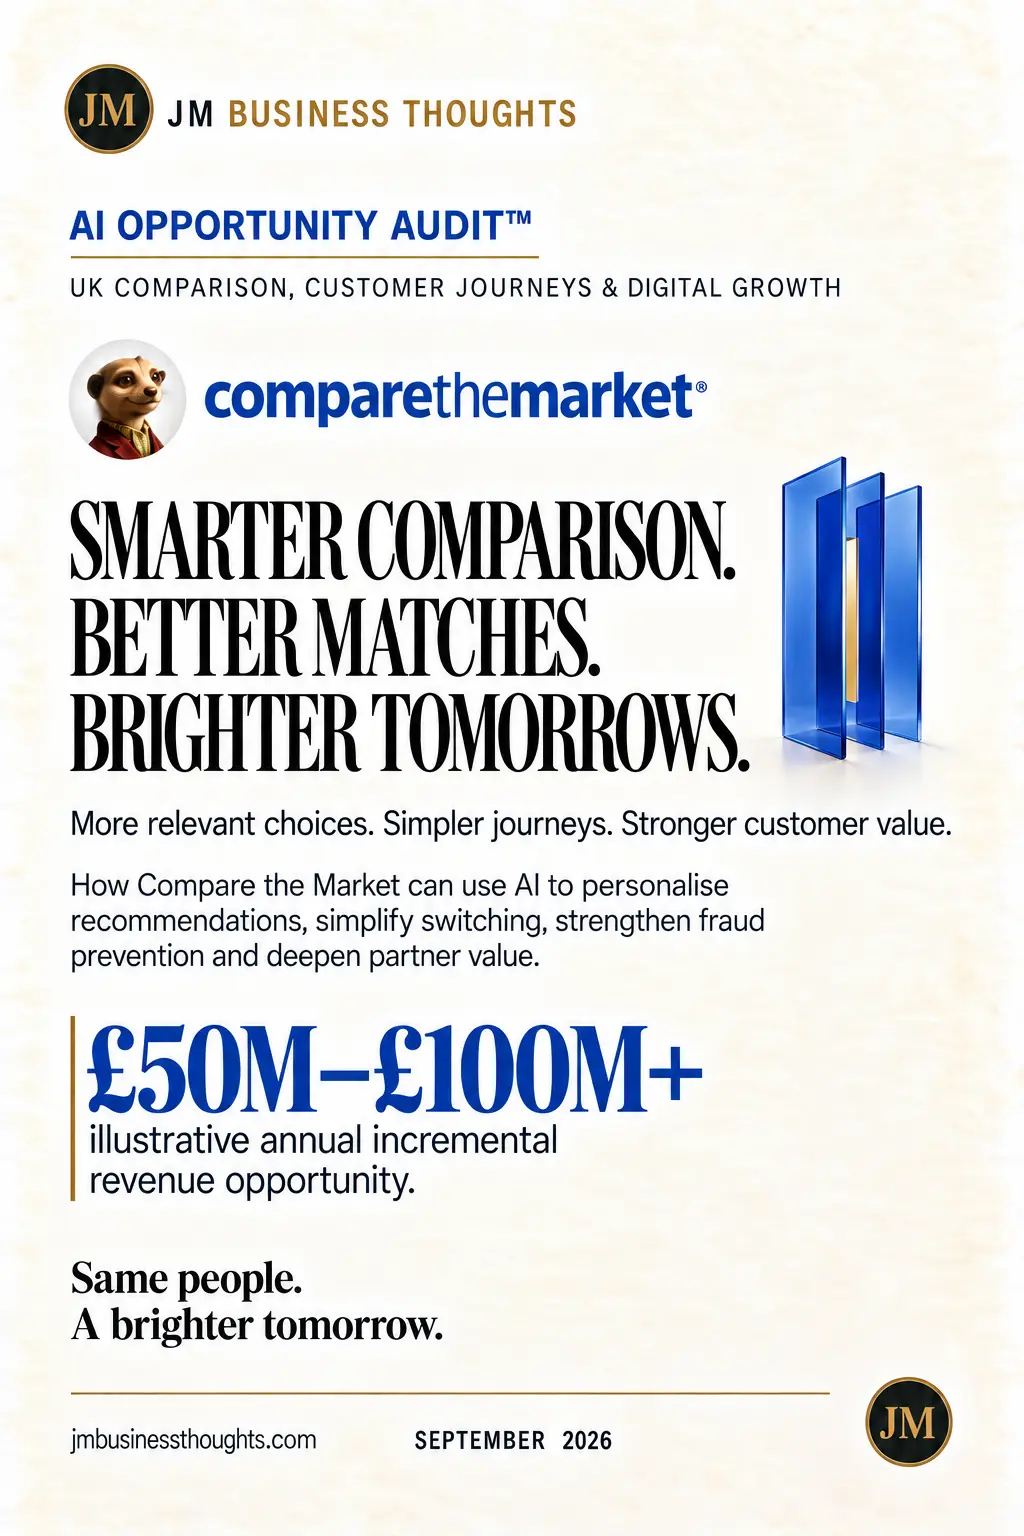
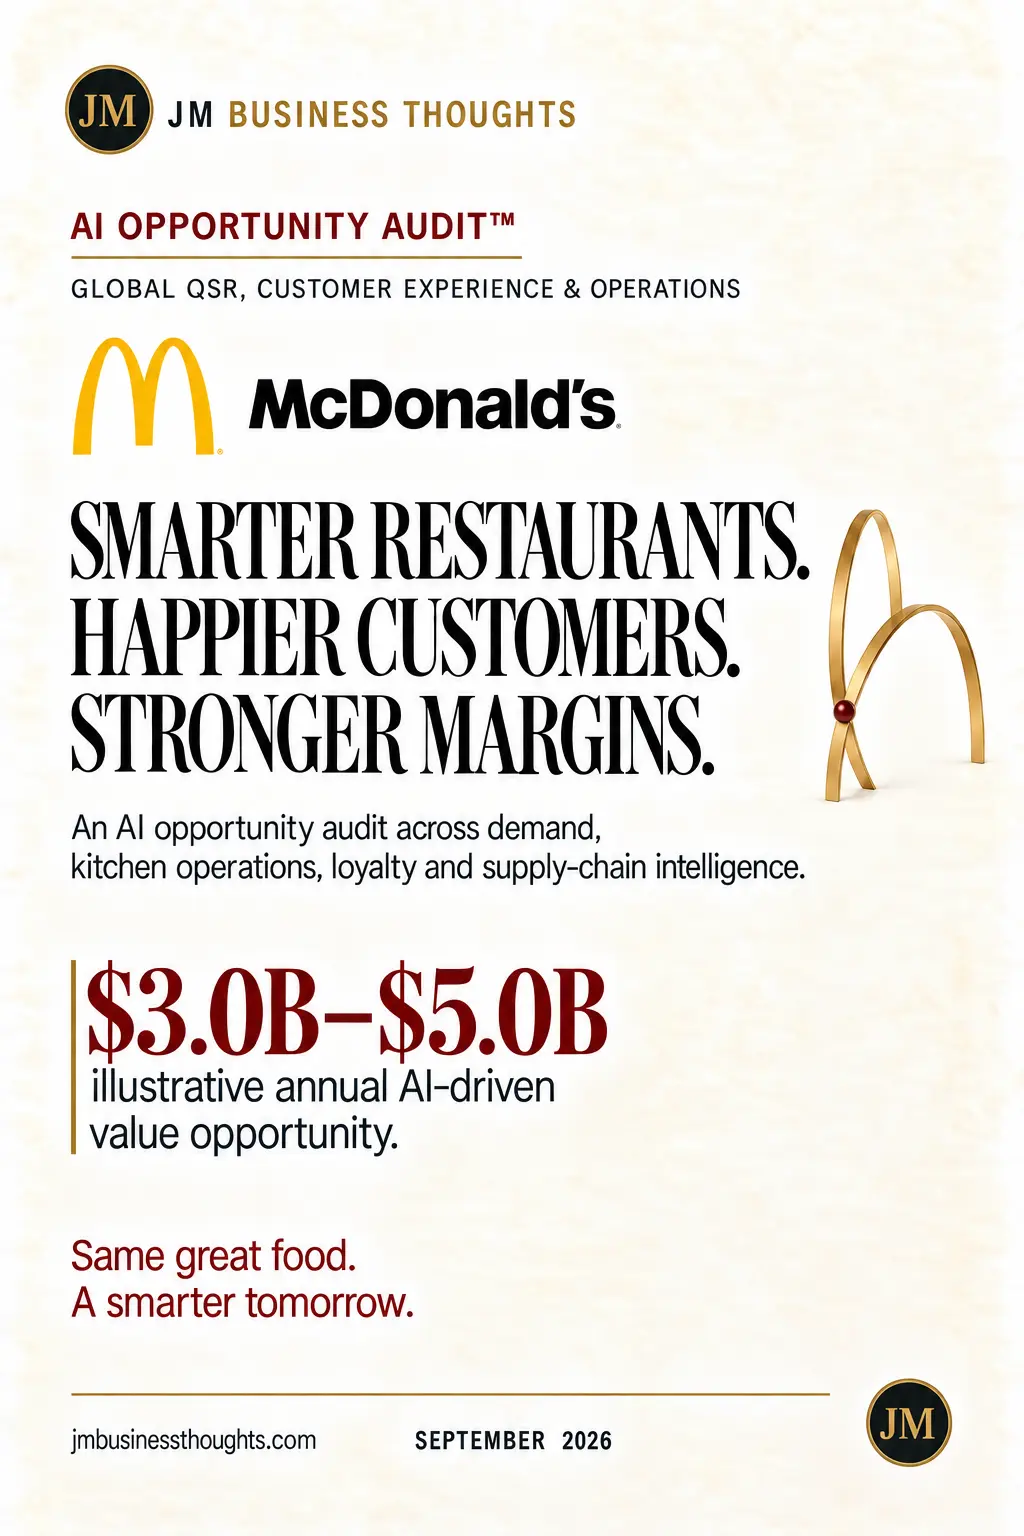
McDonald’s — Serving The Future With AI. research poster
All Research

The Hidden AI Operating System Audit Series™

Where AI creates new profit pools—not just productivity.

65AI Opportunity Audit™ 19 min readSeptember 2026
Coverage · Global · 100+ Countries · Institutional CoverageSector · Quick Service Restaurants, Digital Commerce & OperationsFormat · Six-page audit

McDonald’s — Serving The Future With AI.Faster service. Smarter kitchens. Better value for every customer.

McDonald’s operates 43,000+ restaurants across 100+ countries, serving 70M+ customers a day on $130BN+ of system-wide sales with a digital and loyalty base of 175M+ members. This audit sizes $3.0BN–$6.0BN+ of illustrative annual AI-driven value by 2030 across seven multipliers spanning drive-thru and ordering, personalisation and loyalty, kitchen and labour, delivery, supply chain, pricing and franchisee performance — at a scale where a single second of service time is a measurable global number.

Annual AI Value by 2030

$3.0BN – $6.0BN+

Restaurants Worldwide

43,000+

Countries

100+

Customers Served Daily

70M+

System-Wide Sales

$130BN+

Loyalty Members

175M+

Global QSR Market (2030E)

$1.35TN

Value Multipliers

7

The Thesis

McDonald’s is the largest restaurant business in the world and one of the most operationally disciplined companies in any sector. Its scale is also its arithmetic: 70 million customers a day means every second removed from service time, every point of order accuracy, every basis point of food waste is a nine-figure annual number. The business has already built the two hardest prerequisites for an AI operating system — a global digital and loyalty base of 175M+ members, and a standardised operating model that allows a proven model to be deployed identically across 43,000 restaurants. What remains is the intelligence layer between them: demand-aware kitchens, predictive labour, personalised menus and franchisee-level performance analytics. Faster service. Smarter kitchens. Better value for every customer.

Exhibit · Report Cover

65 · AI Opportunity Audit™

McDonald’s — Serving The Future With AI. report cover
McDonald’s — Serving The Future With AI.September 2026 · Global · 100+ Countries · Institutional Coverage
01

Executive summary — the world’s largest restaurant business, with an AI layer still to build

At a glance: 43,000+ restaurants, 100+ countries, 70M+ customers served daily, $130BN+ of system-wide sales and 175M+ loyalty members.

McDonald’s combines unmatched physical scale with a genuinely global digital footprint. Its franchise model means intelligence, once proven, deploys across thousands of operators with consistent standards — a distribution advantage almost no other business possesses.

Six key value levers frame the audit: drive-thru and ordering intelligence; personalisation and loyalty; kitchen and labour optimisation; delivery and last-mile economics; supply chain and food waste; and menu, pricing and franchisee performance.

Illustrative annual AI-driven value potential by 2030: $3.0BN – $6.0BN+, delivered through faster throughput, higher average check, lower waste and improved labour productivity.

70 million customers a day. Every second of service time is a nine-figure number.
  • 43,000+ restaurants · 100+ countries · 70M+ daily customers
  • $130BN+ system-wide sales · 175M+ loyalty members
  • $3.0BN – $6.0BN+ illustrative annual AI value by 2030
  • Franchise standardisation is a deployment advantage, not a constraint
02

Market and competitive overview — a $1.35TN category going digital

The global quick service restaurant market is modelled at $1.00TN (2024), $1.06TN (2025), $1.13TN (2026), $1.24TN (2028) and $1.35TN (2030).

Five market trends define the environment: digital ordering and delivery as default rather than differentiator; value-seeking behaviour under sustained cost-of-living pressure; labour scarcity and wage inflation across developed markets; loyalty programmes becoming the primary customer data asset; and rising expectations on sourcing, nutrition and packaging.

The competitive landscape includes Starbucks, Yum! Brands (KFC, Taco Bell), Restaurant Brands International (Burger King), Chick-fil-A, Domino’s and Wendy’s. Domino’s and Starbucks are the digital maturity benchmarks; Chick-fil-A is the throughput benchmark.

McDonald’s illustrative positioning is very high on scale, brand and supply chain discipline, high on digital ordering and loyalty reach, and medium on applied AI in kitchen, labour and pricing — which is where the headroom is concentrated.

Digital ordering is table stakes. Applied intelligence behind the counter is not.
  • Global QSR market: $1.00TN (2024) → $1.35TN (2030)
  • Competitive set: Starbucks, Yum! Brands, RBI, Chick-fil-A, Domino’s, Wendy’s
  • Digital ordering and loyalty reach: high · applied AI maturity: medium
  • Labour scarcity and value-seeking behaviour are the two dominant pressures
03

The service layer — drive-thru, kitchen and labour

Drive-thru and ordering intelligence ($700m–$1.4bn by 2030) is the flagship lever: voice ordering, order accuracy models and dynamic menu boards that adapt to queue length, daypart and weather. Drive-thru is the majority channel in the largest markets, so seconds convert directly into transactions.

Kitchen and production intelligence ($500m–$1.0bn) forecasts demand at 15-minute granularity, sequences production to predicted rather than historic orders, and holds quality while cutting hold-time waste.

Labour and shift optimisation ($450m–$900m) deploys AI rostering against forecast transactions — the most direct margin lever in a business facing structural wage inflation, and the one franchisees feel first.

Order accuracy is the quiet compounding win. Errors cost twice: the remake, and the trust. At 70 million daily transactions, a one-point accuracy gain is a brand-scale outcome, not an operational one.

Order errors cost twice: the remake, and the trust.
  • 01 Drive-thru & ordering intelligence · $700m–$1.4bn — the largest lever
  • 03 Kitchen & production intelligence · $500m–$1.0bn
  • 04 Labour & shift optimisation · $450m–$900m
  • Forecast granularity of 15 minutes changes both waste and speed
04

The demand layer — loyalty, delivery, pricing and franchisee performance

Personalisation and loyalty ($600m–$1.2bn) works a 175M-member base with next-best-offer, frequency modelling and churn prediction. This is the cheapest growth in the model because the audience is already owned and identified.

Delivery and last-mile economics ($350m–$700m) optimises aggregator mix, prep-time prediction and courier hand-off — the channel with the fastest growth and the weakest unit economics, therefore the greatest sensitivity to modelling.

Supply chain, sourcing and food waste ($400m–$800m) applies demand-linked ordering, shelf-life intelligence and supplier risk analytics across one of the world’s most complex food supply networks.

Menu, pricing and franchisee performance ($400m–$800m) covers price elasticity by market and daypart, promotion optimisation and franchisee benchmarking — critical when affordability perception is the category’s central strategic risk.

175 million identified members is the cheapest growth in the model.
  • 02 Personalisation & loyalty · $600m–$1.2bn
  • 05 Delivery & last-mile economics · $350m–$700m
  • 06 Supply chain, sourcing & food waste · $400m–$800m
  • 07 Menu, pricing & franchisee performance · $400m–$800m
05

Financial impact model (illustrative) — a faster, leaner, more valuable system

System-wide sales ($bn) are modelled at 130 (FY2025 base), 137 (FY2026E), 146 (FY2027E), 156 (FY2028E), 167 (FY2029E) and 180 (FY2030E).

AI-driven revenue uplift ($bn) builds 0.5 → 1.1 → 1.9 → 2.9 → 4.1 across the period, with cost and waste savings ($bn) of 0.3 → 0.6 → 1.0 → 1.4 → 1.9.

Company operating margin moves from 45.5% to 46.0%, 46.6%, 47.3%, 48.0% and 48.8%, reflecting a franchised model where system efficiency flows through royalties and company-operated performance.

Cumulative AI value creation reaches $12.7bn by FY2030E on the illustrative path (0.8, 2.5, 5.4, 9.3, 12.7 running total). Key assumptions: phased deployment across markets, franchisee adoption in line with historical technology rollouts, no material change to brand positioning, and disciplined capital allocation. Illustrative JM Business Thoughts scenario — not company guidance.

System-wide sales $130bn → $180bn, with $12.7bn of cumulative AI value by FY2030E.
  • System-wide sales ($bn): 130 → 180
  • AI revenue uplift ($bn): 0.5 → 4.1
  • Cost and waste savings ($bn): 0.3 → 1.9
  • Company operating margin: 45.5% → 48.8%
06

AI transformation roadmap — five phases

Phase 1, Foundation (0–6 months): unify restaurant, customer and supply data, set AI governance and franchisee data standards, and identify quick wins in labour and waste.

Phase 2, Pilot & Prove (6–12 months): pilot drive-thru voice and order accuracy, kitchen forecasting and AI rostering in selected markets; measure at restaurant-economics level, not project level.

Phase 3, Scale Operations (12–24 months): scale proven models across company-operated restaurants and lead franchisee markets, deploy demand-linked ordering, and roll out delivery prep-time prediction.

Phase 4, Integrate Demand & Supply (24–36 months): connect loyalty personalisation to kitchen and supply planning end to end, add pricing and promotion intelligence, and expand franchisee benchmarking globally.

Phase 5, Lead & Innovate (36+ months): an AI-native restaurant operating model, new formats and automation, and continuous menu innovation from demand data. Success factors: franchisee alignment and incentives, data quality across a distributed estate, crew experience design, and disciplined change management.
Franchisee alignment is the deployment strategy. Everything else is engineering.
  • Phase 1 Foundation · 0–6 months · Phase 2 Pilot & Prove · 6–12 months
  • Phase 3 Scale Operations · 12–24 months
  • Phase 4 Integrate Demand & Supply · 24–36 months
  • Phase 5 Lead & Innovate · 36+ months
07

Sources and method

Company data: McDonald’s public reporting — restaurant count, country footprint, system-wide sales, daily customer volume and loyalty membership scale.

Market sizing: global quick service restaurant market, 2024–2030E, from published industry research.

Competitive landscape: positioning for Starbucks, Yum! Brands, Restaurant Brands International, Chick-fil-A, Domino’s and Wendy’s; digital and AI maturity assessments are analyst-assigned and directional.

Method note: each multiplier is sized independently against disclosed system-wide sales and restaurant scale, then netted for overlap before the total annual range is stated. Illustrative JM Business Thoughts scenario — not company guidance.

The Multiplier Framework

7 compounding levers

The seven AI multipliers that unlock exponential value across 43,000 restaurants — aggregating to $3.0BN – $6.0BN+ of illustrative annual value by 2030.

01

Drive-Thru & Ordering Intelligence

Faster service, higher order accuracy · $700m–$1.4bn.

  • Voice ordering and accuracy models
  • Dynamic menu boards by queue, daypart and weather
  • Second-by-second throughput measurement

Outcome · Seconds removed at 70 million daily transactions

02

Personalisation & Loyalty

Higher frequency and check size · $600m–$1.2bn.

  • Next-best-offer across 175M+ members
  • Frequency and churn modelling
  • Reward economics over discount depth

Outcome · The cheapest growth in the model

03

Kitchen & Production Intelligence

Right food, right moment, less waste · $500m–$1.0bn.

  • 15-minute demand forecasting
  • Production sequencing to predicted orders
  • Hold-time and quality optimisation

Outcome · Speed and waste improved together

04

Labour & Shift Optimisation

Right crew, right hour · $450m–$900m.

  • AI rostering against forecast transactions
  • Skills-based deployment by station
  • Overtime and absence prediction

Outcome · The most direct margin lever under wage inflation

05

Delivery & Last-Mile Economics

Fix the fastest-growing, thinnest-margin channel · $350m–$700m.

  • Prep-time prediction and courier hand-off timing
  • Aggregator mix and commission optimisation
  • Order batching and packaging intelligence

Outcome · Delivery economics modelled, not absorbed

06

Supply Chain, Sourcing & Food Waste

Availability up, waste down · $400m–$800m.

  • Demand-linked restaurant ordering
  • Shelf-life and batch intelligence
  • Supplier risk and sourcing analytics

Outcome · Waste reduction across a global network

07

Menu, Pricing & Franchisee Performance

Protect affordability while defending margin · $400m–$800m.

  • Price elasticity by market and daypart
  • Promotion and value-menu optimisation
  • Franchisee benchmarking and coaching analytics

Outcome · Value perception managed with evidence

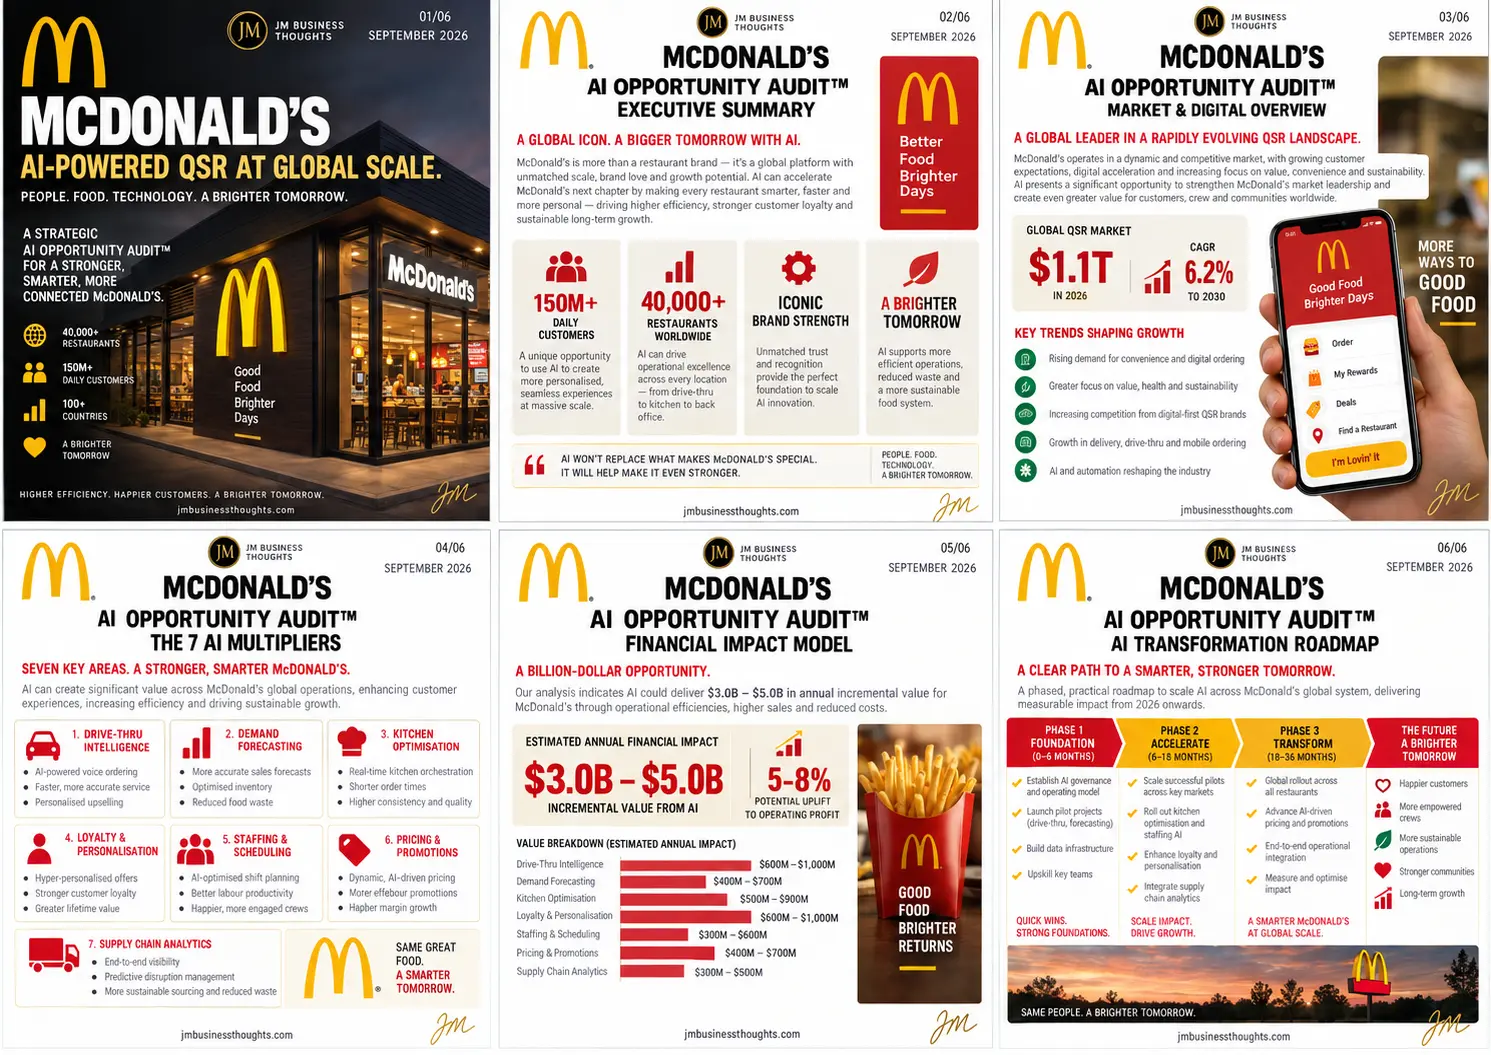
McDonald’s — Serving The Future With AI. full strategic breakdown
AI Opportunity Audit™ · McDonald’s — the full six-page institutional report covering the cover and at-a-glance system scale, the executive summary and key value levers, the global QSR market and competitive overview, the seven AI multipliers with value ranges, the illustrative financial impact model, and the five-phase AI transformation roadmap.

The Verdict

43,000+ restaurants, 100+ countries, 70M+ customers a day, $130BN+ of system-wide sales and 175M+ loyalty members — with applied AI maturity still rated medium behind the counter. Seven multipliers, led by drive-thru intelligence, loyalty personalisation and kitchen forecasting, size $3.0BN – $6.0BN+ of illustrative annual value by 2030 and $12.7bn cumulative by FY2030E. Faster service. Smarter kitchens. Better value for every customer.

JM founder signature
68 · PureGym — Fitness At Scale. More Personal. More Inclusive.67 · SIXT — Smarter Mobility. Greater Availability. A More Connected Tomorrow.66 · Sendwave — Money That Moves With Intelligence.63 · WeBuyAnyCar — Smarter Pricing. Faster Offers. Better Conversion.62 · Primark — Affordable Fashion. Greater Possibilities With AI.61 · Starbucks — Smarter Stores. Stronger Loyalty. Better Margins.60 · IKEA — AI-Powered Home Retail at Global Scale59 · H&M — Smarter Fashion. Brighter Tomorrow.58 · WeWork — The Value Wasn't Lost. It Was Mispriced.57 · Yahoo — The Value Wasn't Lost. It Was Mispriced.56 · Nando's UK — Smarter Restaurants. Stronger Loyalty. Better Margins.55 · The Amplifier54 · The Body Shop53 · Arcadia Group52 · Cazoo51 · Blockbuster50 · Carpetright49 · Wilko48 · Mothercare47 · Phones 4u46 · Farfetch45 · Jumia44 · Toys ‘R’ Us43 · The Collateral Gap — Part One41 · The Amplifier40 · Africa Bee Farming39 · Kenya Airways38 · Africa Greenhouse Farming37 · Uganda Tourism Board36 · Boots UK35 · Biffa (UK)34 · NatWest33 · Skip Hire Companies UK33 · The Audit32 · The Lean Company31 · Africa Mushroom Farming29 · The Rider Economy Nobody Verified28 · The Layer Underneath the Layer27 · Independent Timber Yards & Jewson Timber26 · Link Up TV & GRM Daily25 · East African Portland Cement42 · International Student Credential & Financial Verification — Part One24 · The Supply Chain Inside the Supply Chain23 · The White Space, Mapped22 · The Real Opportunity21 · Greencore20 · West Ham United19 · Roofings Group Uganda18 · Mombasa Port17 · Auto Trader UK16 · Uganda Coffee Development Authority15 · Brookside Dairy14 · GraceKennedy13 · Rightmove12 · Manchester United11 · Greggs30 · Twiga Foods10 · Uchumi09 · Konga08 · Edcon09 · GAME07 · Debenhams06 · Claire's05 · Boohoo04 · Argos