Blockbuster: The Value Wasn’t Lost. It Was Mispriced. research poster
All Research
51Mispriced Assets™ 20 min readSeptember 2026
Coverage · Global · United States & International · Institutional CoverageSector · Entertainment · Content, Retail Experience & Digital PlatformsFormat · Six-page audit

BlockbusterA Case Study In Strategic Value Overlooked, Not Destroyed.

Blockbuster is a 39-year iconic brand with roughly 90% unaided recognition, a 9,000-store peak footprint and a $5BN+ content supplier ecosystem. The brand is legendary; the assets are real; the opportunity is mispriced. A consumer shift toward nostalgia, physical experiences and value entertainment — combined with AI-supported streaming growth — creates a rare window to relaunch Blockbuster as a hybrid digital and physical entertainment platform. This audit sizes $200M – $400M+ of annual value by 2030.

Years Of Iconic Brand

39

Unaided Brand Recognition

90%

Pre-Store Locations (Peak)

9,000+

Content Supplier Ecosystem

$5BN+

Global Entertainment Market (2027E)

$918BN

Annual Value By 2030

$200M – $400M+

Enterprise Value Potential

$300M – $600M+

Free Cash Flow Potential

$20M – $120M+

The Thesis

Blockbuster is remembered as the definitive case study in disruption. That reading confuses one distribution model with the whole asset base. What died was late-fee video rental. What survived is a globally recognised brand with roughly 90% unaided recall, a vault of content relationships, prime retail footprint knowledge and a re-engineering playbook. Today’s entertainment consumer is showing measurable subscription fatigue, price sensitivity and a strong pull toward nostalgia and physical experience — the exact conditions in which a hybrid physical-plus-digital entertainment brand outperforms a pure streamer. Blockbuster’s greatest asset isn’t its past; it’s the future it can own. Rebuilt on subscription, advertising, content partnerships and experiential retail, the brand supports $200M – $400M+ of annual value by 2030 against a $20M – $60M enterprise value today.

Exhibit · Report Cover

51 · Mispriced Assets™

Blockbuster: The Value Wasn’t Lost. It Was Mispriced. report cover
Blockbuster: The Value Wasn’t Lost. It Was Mispriced.September 2026 · Global · United States & International · Institutional Coverage
01

Executive summary: iconic brand, real assets, modern opportunity

Blockbuster’s combination of brand equity, real estate knowledge, content network and operating expertise is severely undervalued in today’s digital-first world.

A consumer shift toward nostalgia, physical experiences and value entertainment — combined with AI-supported streaming growth — creates a rare window to relaunch Blockbuster as a hybrid digital and physical entertainment platform.

We estimate Blockbuster’s mispriced assets could unlock $200M – $400M+ in annual value by 2030 through subscription, advertising, content partnerships and experiential retail.

At a glance: an iconic brand with 90% unaided recognition; a 9,000+ store peak footprint; a strong content supplier and studio relationship ecosystem; prime retail footprint and redevelopment knowledge; and a digital platform plus experiential retail opportunity.

The financial snapshot: revenue $0 – $100M today against $200M – $400M+ in a three-to-five year AI-enhanced case. Adjusted EBITDA margin (10%) – (5%) against 15% – 25%. Free cash flow $0M – $5M against $20M – $120M+. Enterprise value $20M – $60M against $300M – $600M+.

Enterprise value $20M – $60M today. $300M – $600M+ on a hybrid platform relaunch.
  • Brand nostalgia drives trust and trial with almost no acquisition cost
  • Retail footprint enables experience and last mile
  • Content plus data drives a platform flywheel
  • Subscription plus ads deliver recurring revenue
  • Smart reinvention with a lean next-generation platform
02

The mispricing: what actually failed

Blockbuster did not fail because consumers stopped wanting entertainment. It failed because a fixed-cost store network monetised through late fees could not survive a variable-cost digital substitute.

That is a distribution failure. The brand, the studio relationships, the merchandising expertise and the consumer memory are separate assets, and they were written to nil alongside the model that failed.

Ninety percent unaided recognition is the single largest mispriced line. In a market where a new streaming brand spends hundreds of millions to reach meaningful awareness, Blockbuster starts with recall that money cannot efficiently buy — and with emotional equity, which money cannot buy at all.

The second is category timing. Subscription fatigue is measurable: households are cutting services, ARPU pressure is rising and churn is structural. Nostalgia and physical experience are counter-cyclical to that fatigue.

The third is format optionality. Blockbuster can be a streaming service, a membership, a retail experience, a licensing business or all four — because the brand grants permission across every one of them. Very few dormant assets carry that breadth.

Blockbuster’s greatest asset isn’t its past — it’s the future it can own.
  • Failed: fixed-cost store network monetised by late fees
  • Intact: 90% unaided recall and generational emotional equity
  • Timing: subscription fatigue and churn favour hybrid and nostalgia formats
  • Optionality: streaming, membership, retail, licensing — all brand-permitted
03

Market overview: a $918BN category by 2027

The global entertainment market is large and growing across digital, physical and experiential formats.

Market size runs $674BN in 2023, $728BN in 2024, $785BN in 2025E, $849BN in 2026E and $918BN in 2027E.

Streaming subscriptions are rising, but content fatigue and price sensitivity are creating churn. Nostalgia and physical experiences are powerful drivers of engagement and loyalty. Hybrid models — physical plus digital plus community — are the next frontier.

The competitive landscape frames the white space. Netflix: streaming leader with scale, content and technology, but high cost and churn. Disney+: family and franchise strength in commerce and content, under ARPU pressure. Prime Video: reach and ecosystem, with content spend exposure. Blockbuster (legacy): nostalgia plus hybrid, with brand, retail and experience strengths — reinvention needed. Local indie stores: niche and curated with community focus, but limited scale.

No incumbent owns the intersection of nostalgia, physical experience and digital delivery. That intersection is Blockbuster’s natural position.

$674BN → $918BN by 2027 — with churn rising and nostalgia counter-cyclical.
  • Global entertainment market: $674BN (2023) → $918BN (2027E)
  • Subscription growth continues but content fatigue drives churn
  • Hybrid physical, digital and community models are the next frontier
  • No major player owns nostalgia plus experience plus digital
04

Where the value actually sits

Four value pools define the rebuild, and none require rebuilding a 9,000-store estate.

The first is content discovery and personalisation. Smarter recommendations, curation, taste graphs and sequencing drive engagement in a category where discovery is the primary retention lever — $25M – $50M a year.

The second is pricing and promotions. Conversion and ARPU across channels respond directly to AI pricing, promo engines and elasticity modelling — $20M – $40M a year.

The third is experience monetisation. A curated retail and events footprint converts nostalgia into transaction: memberships, screenings, collectibles, licensed merchandise and partner activations.

The fourth is media and advertising. A branded ad-supported tier with segmentation and dynamic yield management monetises reach at margin far above rental economics ever delivered — $15M – $25M a year.

  • Discovery: curation and taste graphs drive retention, not content spend
  • Pricing: elasticity-led ARPU and conversion across channels
  • Experience: membership, events, collectibles and licensed retail
  • Advertising: ad-supported tier with dynamic yield management
05

Financial impact model: FY2024 to FY2028E

The illustrative five-year model runs a phased transformation, store optimisation and platform build.

Revenue (US$M): 40 → 85 → 150 → 240 → 345. Gross margin: 30% → 35% → 40% → 45% → 45%. Adjusted EBITDA margin: (5%) → 2% → 8% → 14% → 18%, giving adjusted EBITDA (US$M) of (2) → 2 → 12 → 34 → 62.

Free cash flow (US$M): (5) → (1) → 8 → 25 → 50. Capex (US$M): (3) → (3) → (10) → (15) → (15). Net debt and cash (US$M): (10) → (8) → (8) → 5 → 15. ROIC: (3%) → (1%) → 6% → 12% → 15%.

Cumulative value creation over five years compounds across revenue, adjusted EBITDA, free cash flow and enterprise value — with enterprise value modelled at 60 → 150 → 260 → 460 → 600 (US$M).

The model assumes phased transformation, store optimisation, platform build and market-by-market rollout — not a return to a 9,000-store estate.

Revenue $40M → $345M. Enterprise value $60M → $600M over five years.
  • Revenue (US$M): 40 → 85 → 150 → 240 → 345
  • Adjusted EBITDA (US$M): (2) → 2 → 12 → 34 → 62
  • Free cash flow (US$M): (5) → (1) → 8 → 25 → 50
  • Enterprise value (US$M): 60 → 150 → 260 → 460 → 600
  • ROIC: (3%) → 15%
06

AI transformation roadmap: five phases

Phase 1 (0–6 months) — Foundation: data and analytics foundation, brand and consumer insights, technology and talent assessment, quick-win activations, test and learn with teams and partners.

Phase 2 (6–12 months) — Digital core platform: build the direct-to-consumer app, catalogue and content engine, AI and ML stack recommendations, loyalty and member programme redesign, pilot store formats.

Phase 3 (12–24 months) — Scale experience: store refresh and innovation, events, rentals and live activations, membership and ad-sales marketplace, retail media network, partnership and bundles scale.

Phase 4 (24–36 months) — Ecosystem and expansion: multi-brand expansion, marketplace and third-party services, originals and content creation, data and ad platform scale, B2B licensing.

Phase 5 (36–60 months) — Lead and innovate: AI-native operations, new formats and experiences, global fan ecosystem leadership, sustainable community and entertainment scale.

Success factors: iconic brand trust and nostalgia, content-owner partnerships, retail plus experience fusion, data and platform scale, and a strong partner ecosystem. Key enablers: a modern data platform, AI and ML automation, cloud and scalable infrastructure, talent and culture, and an agile operating model. Next steps: validate opportunity, build sponsor pool, secure first wins, expand to new verticals, and lead the category.

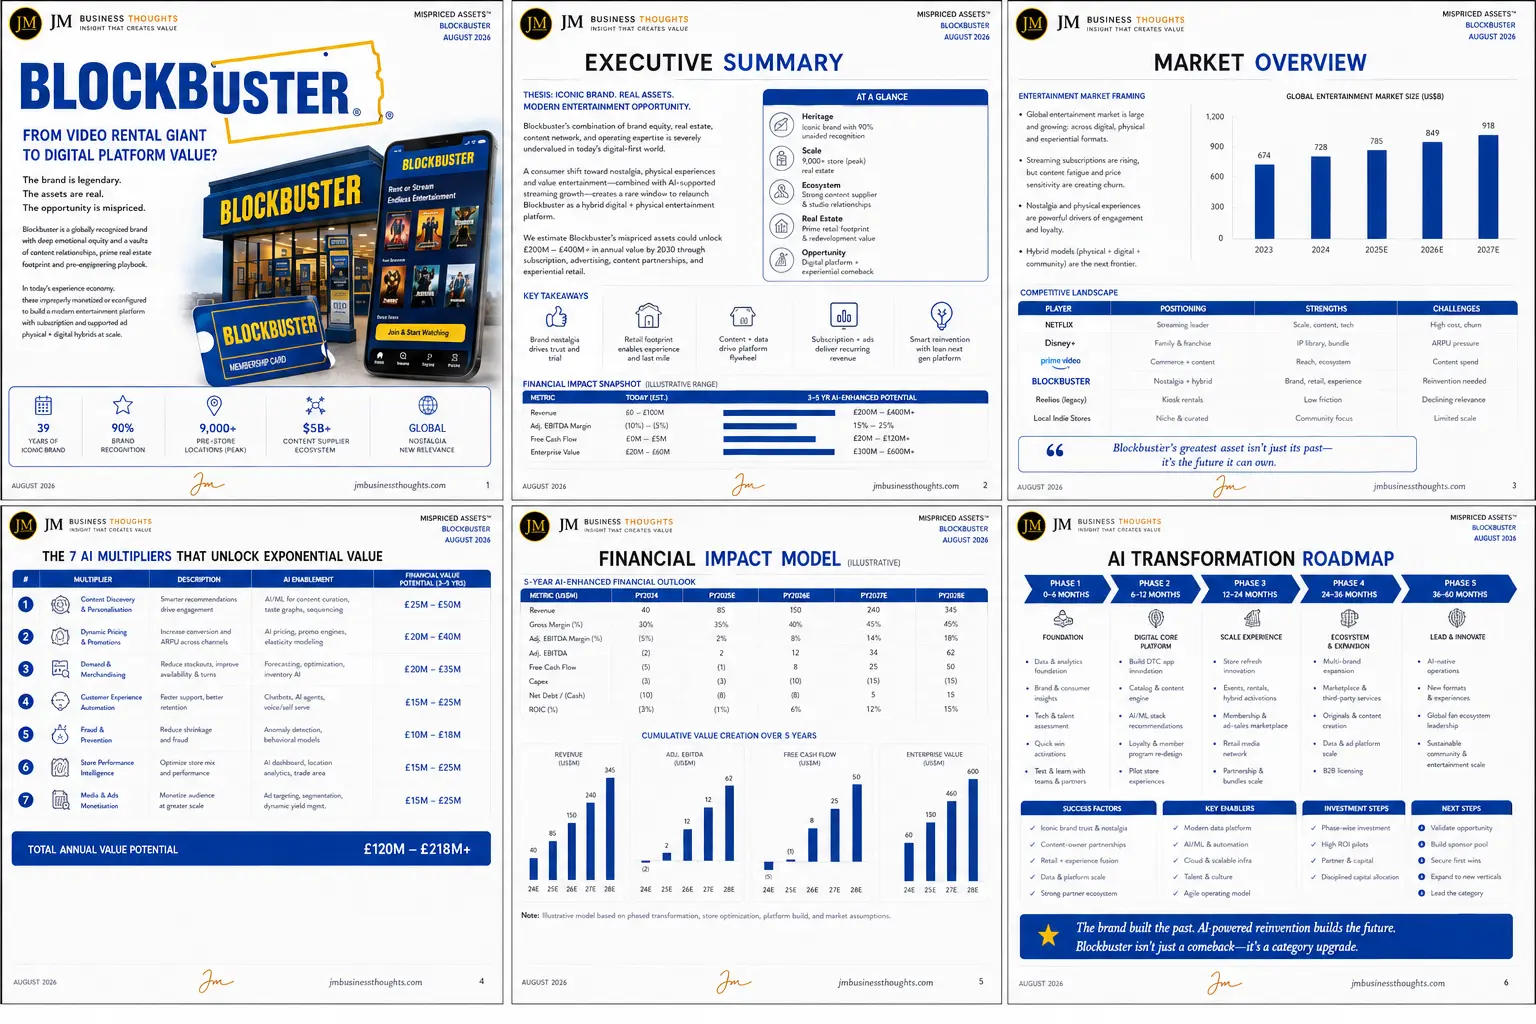
The brand built the past. AI-powered reinvention builds the future.

The Multiplier Framework

7 compounding levers

Seven AI multipliers, each with a defined mechanism, application set and annual value range — aggregating to $120M – $218M+ of illustrative annual value potential over three to five years, and $200M – $400M+ of total annual value by 2030 including experience and licensing.

01

Content Discovery & Personalisation

Smarter recommendations drive engagement in a discovery-led category.

  • AI and ML for content curation
  • Taste graphs and viewing sequencing
  • Personalised merchandising across app and store

Outcome · $25M – $50M per year

02

Dynamic Pricing & Promotions

Increase conversion and ARPU across channels.

  • AI pricing and promo engines
  • Elasticity modelling by cohort and market
  • Bundle and membership optimisation

Outcome · $20M – $40M per year

03

Demand & Merchandising

Reduce stockouts and improve availability and turns.

  • Forecasting and inventory optimisation
  • Assortment planning by store and region
  • Collectibles and licensed product planning

Outcome · $20M – $35M per year

04

Customer Experience Automation

Faster support, better retention.

  • Chatbots and AI agents
  • Voice and self-serve resolution
  • Member lifecycle and churn intervention

Outcome · $15M – $25M per year

05

Fraud & Prevention

Reduce shrinkage and fraud across digital and physical.

  • Anomaly detection on transactions
  • Behavioural risk models
  • Account and subscription abuse control

Outcome · $10M – $18M per year

06

Store Performance Intelligence

Optimise store mix and performance.

  • AI dashboards and location analytics
  • Trade area modelling
  • Format and event performance benchmarking

Outcome · $15M – $25M per year

07

Media & Ads Monetisation

Monetise audience at greater scale.

  • Ad targeting and segmentation
  • Dynamic yield management
  • Retail media and partner sponsorship

Outcome · $15M – $25M per year

Blockbuster: The Value Wasn’t Lost. It Was Mispriced. full strategic breakdown
Mispriced Assets™ · UK & Global Retail Lost Giants — Blockbuster: the full six-page institutional report covering the cover and at-a-glance brand estate, executive summary and financial impact snapshot, global entertainment market overview and competitive landscape, the seven AI multipliers, the five-year financial impact model and the five-phase AI transformation roadmap.

The Verdict

Thirty-nine years of iconic brand, 90% unaided recognition, a 9,000-store peak footprint and a $5BN+ content supplier ecosystem — written off with a rental model that was only ever one distribution format. The category grew to $918BN while subscription fatigue opened the exact window a nostalgia-plus-experience brand is built for. Seven multipliers worth $120M – $218M+ a year take revenue from $40M to $345M and enterprise value from $60M to $600M. Blockbuster isn’t just a comeback — it’s a category upgrade.

JM founder signature
68 · PureGym — Fitness At Scale. More Personal. More Inclusive.67 · SIXT — Smarter Mobility. Greater Availability. A More Connected Tomorrow.66 · Sendwave — Money That Moves With Intelligence.65 · McDonald’s — Serving The Future With AI.64 · Compare the Market — Smarter Comparison. Better Matches. Brighter Tomorrows.63 · WeBuyAnyCar — Smarter Pricing. Faster Offers. Better Conversion.62 · Primark — Affordable Fashion. Greater Possibilities With AI.61 · Starbucks — Smarter Stores. Stronger Loyalty. Better Margins.60 · IKEA — AI-Powered Home Retail at Global Scale59 · H&M — Smarter Fashion. Brighter Tomorrow.58 · WeWork — The Value Wasn't Lost. It Was Mispriced.57 · Yahoo — The Value Wasn't Lost. It Was Mispriced.56 · Nando's UK — Smarter Restaurants. Stronger Loyalty. Better Margins.55 · The Amplifier54 · The Body Shop53 · Arcadia Group52 · Cazoo49 · Wilko48 · Mothercare47 · Phones 4u46 · Farfetch45 · Jumia44 · Toys ‘R’ Us43 · The Collateral Gap — Part One41 · The Amplifier40 · Africa Bee Farming39 · Kenya Airways38 · Africa Greenhouse Farming37 · Uganda Tourism Board36 · Boots UK35 · Biffa (UK)34 · NatWest33 · Skip Hire Companies UK33 · The Audit32 · The Lean Company31 · Africa Mushroom Farming29 · The Rider Economy Nobody Verified28 · The Layer Underneath the Layer27 · Independent Timber Yards & Jewson Timber26 · Link Up TV & GRM Daily25 · East African Portland Cement42 · International Student Credential & Financial Verification — Part One24 · The Supply Chain Inside the Supply Chain23 · The White Space, Mapped22 · The Real Opportunity21 · Greencore20 · West Ham United19 · Roofings Group Uganda18 · Mombasa Port17 · Auto Trader UK16 · Uganda Coffee Development Authority15 · Brookside Dairy14 · GraceKennedy13 · Rightmove12 · Manchester United11 · Greggs30 · Twiga Foods10 · Uchumi09 · Konga08 · Edcon09 · GAME07 · Debenhams06 · Claire's05 · Boohoo04 · Argos