Carpetright: The Value Wasn’t Lost. It Was Mispriced. research poster
All Research
50Mispriced Assets™ 20 min readSeptember 2026
Coverage · United Kingdom & Ireland · ~270 Stores · Institutional CoverageSector · Flooring & Home Interiors · Retail, Fitting & Installation ServicesFormat · Six-page audit

CarpetrightA Case Study In Strategic Value Overlooked, Not Destroyed.

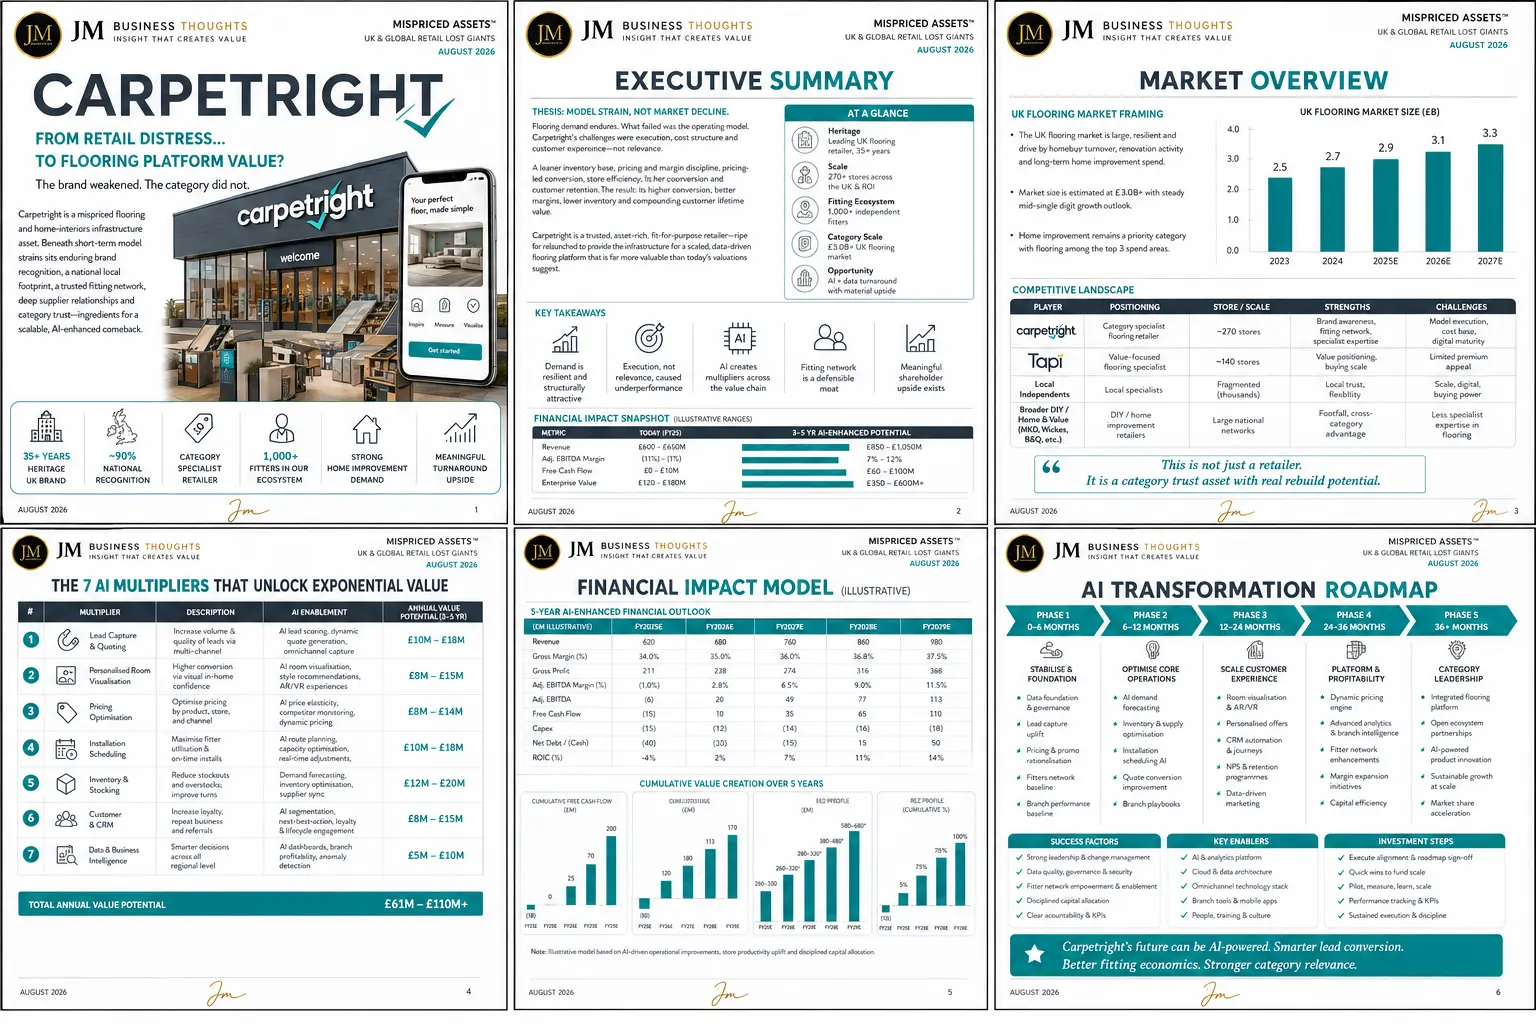
Carpetright is a 35+ year UK flooring brand with ~90% national recognition, around 270 stores across the UK and Ireland and an ecosystem of roughly 1,000 independent fitters. Demand for flooring did not fall away — it is driven by homebuyer turnover, renovation and long-term home improvement spend in a £3.0BN+ market. What failed was the operating model: cost structure, inventory weight, lead conversion and store productivity. This audit sizes £61M – £110M+ of annual AI-enabled value potential on a relaunched, asset-light flooring platform.

Years Of UK Heritage

35+

National Brand Recognition

~90%

Stores (UK & ROI)

~270

Independent Fitters

1,000+

UK Flooring Market

£3.0BN+

Market CAGR To 2027

Mid Single Digit

Annual Value Potential

£61M – £110M+

Enterprise Value Upside

£350M – £600M+

The Thesis

Carpetright is read as a failed high-street retailer. It is more accurately a mispriced category infrastructure asset. Flooring is a considered, high-ticket, installation-dependent purchase where trust and a fitting network decide the sale — and Carpetright holds the strongest consumer brand in the category alongside the largest independent fitter ecosystem in the UK. Neither of those assets was destroyed by administration. What was destroyed was an operating model carrying too much store cost, too much slow-moving inventory and no ability to convert digital demand into measured, fitted, installed revenue. Rebuild the same brand and the same fitter network on lead capture, room visualisation, dynamic pricing, installation scheduling and inventory intelligence, and the platform supports £61M – £110M+ of annual value against an enterprise value that collapsed to £120M – £180M.

Exhibit · Report Cover

50 · Mispriced Assets™

Carpetright: The Value Wasn’t Lost. It Was Mispriced. report cover
Carpetright: The Value Wasn’t Lost. It Was Mispriced.September 2026 · United Kingdom & Ireland · ~270 Stores · Institutional Coverage
01

Executive summary: model strain, not market decline

Flooring demand endures. What failed was the operating model. Carpetright’s difficulties were execution, cost structure and customer experience — not relevance.

A leaner inventory base, pricing and margin discipline, pricing-led conversion, store efficiency and fitter conversion and customer retention produce a materially different business: higher conversion, better margins, lower inventory and compounding customer lifetime value.

At a glance: leading UK flooring retailer with 35+ years of heritage; ~90% national recognition; ~270 stores across the UK and Ireland; a 1,000+ independent fitter ecosystem; and a £3.0BN+ UK flooring market with AI plus data turnaround upside on top of material asset value.

The financial snapshot is where the mispricing shows. Revenue £600M – £650M today against £850M – £1,050M in a three-to-five year AI-enhanced case. Adjusted EBITDA margin (11%) – (1%) today against 7% – 12%. Free cash flow £0 – £10M against £60M – £100M. Enterprise value £120M – £180M against £350M – £600M+.

Carpetright is a trusted, asset-rich, fit-for-purpose relaunch — the infrastructure for a scaled, data-driven flooring platform that is far more valuable than today’s valuations suggest.

Enterprise value £120M – £180M today. £350M – £600M+ on a rebuilt operating model.
  • 35+ years of heritage and ~90% national brand recognition
  • ~270 stores across the UK and Republic of Ireland
  • 1,000+ independent fitters — the category’s hardest asset to replicate
  • £3.0BN+ UK flooring market growing at mid single digits
02

The mispricing: what was destroyed versus what was written off

Administration destroyed leases, working capital and equity. It did not destroy the brand, the fitter network, the supplier relationships or the category.

Brand recognition at ~90% in a category people buy roughly once a decade is not a marketing statistic — it is the default consideration set. Rebuilding it from zero would cost more than the entire enterprise value at collapse.

The fitting network is the second mispriced line. One thousand independent fitters constitute a national installation capability that no digital-first entrant has been able to assemble. Flooring is not sold when the customer clicks; it is sold when a fitter arrives on the agreed day and the job is done right.

The third is category trust. Flooring is high-ticket, infrequent and irreversible once installed. Customers buy the reassurance that a mistake will be fixed. That reassurance sits with a national name and an accountable installer — exactly the two assets the market wrote to nil.

This is not just a retailer. It is a category trust asset with real rebuild potential.

This is not just a retailer. It is a category trust asset with real rebuild potential.
  • Destroyed: leases, working capital, equity, legacy cost base
  • Written off but intact: brand, fitter ecosystem, supplier base, category demand
  • ~90% recognition in a once-a-decade purchase is a durable moat
  • Installation capability is the barrier digital-first entrants cannot clear
03

Market overview: a resilient £3BN+ category

The UK flooring market is large, resilient and driven by homebuyer turnover, renovation activity and long-term home improvement spend.

Market size runs £2.5BN in 2023, £2.7BN in 2024, £2.9BN in 2025E, £3.1BN in 2026E and £3.3BN in 2027E — steady mid single digit growth with no structural decline anywhere in the series.

Home improvement remains a priority category, with flooring among the top three spend areas. The demand signal is macro-linked but not cyclical to the point of impairment.

The competitive landscape is instructive. Carpetright: category specialist, ~270 stores, strong brand awareness and fitting network, but model execution, cost base and digital maturity challenges. Tapi: value-focused specialist, ~140 stores, value positioning and buying scale, limited premium appeal. Local independents: thousands of fragmented operators with local trust and flexibility but no scale, digital or buying power. Broader DIY and home value operators — MKD, Wickes, B&Q — have large national networks and cross-category footfall but less specialist expertise in flooring.

The structural gap is clear: nobody in UK flooring combines national brand, specialist expertise, installation capability and a modern data stack. That position is available.

£2.5BN → £3.3BN by 2027. The category compounds; the operator did not.
  • UK flooring market: £2.5BN (2023) → £3.3BN (2027E)
  • Carpetright ~270 stores vs Tapi ~140 and thousands of independents
  • DIY majors carry footfall but lack specialist flooring expertise
  • No incumbent combines brand, fitting scale and digital maturity
04

Where the value actually leaks

Four leaks explain the gap between a £600M revenue base and an EBITDA margin at or below zero.

Lead leakage is the largest. Flooring buyers research online, request a measure, then disappear into a multi-week decision. Without automated quoting, follow-up and omnichannel capture, most of that demand is simply never converted — worth £10M – £18M a year.

Conversion leakage is the second. Customers cannot visualise a floor in their own room, so they defer. AI room visualisation, style recommendation and AR/VR raise in-home confidence and close the deferral gap — £8M – £15M a year.

Inventory leakage is the third and the most damaging to cash. Flooring carries heavy, slow-moving, bulky stock with high overstock and stockout costs in parallel. Demand forecasting, inventory optimisation and supplier sync are worth £12M – £20M a year.

Installation leakage is the fourth. Fitter utilisation, route planning and on-time completion determine both margin and reputation in a category where a missed installation date destroys the customer relationship permanently — £10M – £18M a year.

  • Lead gap: high-intent enquiries lost to slow, manual quoting
  • Confidence gap: no in-room visualisation on an irreversible purchase
  • Inventory gap: bulky slow-moving stock with overstock and stockouts together
  • Installation gap: fitter utilisation and on-time completion drive margin and trust
05

Financial impact model: FY2025E to FY2029E

The illustrative five-year model runs a disciplined relaunch on the existing brand and fitter base.

Revenue (£M): 620 → 680 → 760 → 860 → 980. Gross margin: 34.0% → 35.0% → 36.0% → 36.8% → 37.5%. Gross profit (£M): 211 → 238 → 274 → 316 → 368.

Adjusted EBITDA margin moves (1.0%) → 2.8% → 6.5% → 9.0% → 11.5%, giving adjusted EBITDA (£M) of (6) → 20 → 49 → 77 → 113. Free cash flow (£M) runs (15) → 10 → 35 → 65 → 110 with capex (£M) of (15) → (12) → (14) → (16) → (18).

Net debt and cash (£M) improves (40) → (30) → (15) → 15 → 50, with ROIC moving (4%) → 2% → 7% → 11% → 14%.

The model is driven by AI-led operational improvement, store productivity uplift and disciplined capital allocation — not by new market entry or store expansion.

Revenue £620M → £980M. Adjusted EBITDA (£6M) → £113M in five years.
  • Revenue (£M): 620 → 680 → 760 → 860 → 980
  • Gross margin: 34.0% → 37.5%
  • Adjusted EBITDA (£M): (6) → 20 → 49 → 77 → 113
  • Free cash flow (£M): (15) → 10 → 35 → 65 → 110
  • ROIC: (4%) → 14%
06

AI transformation roadmap: five phases

Phase 1 (0–6 months) — Stabilise and found: data foundation and governance, lead capture uplift, pricing and promotion rationalisation, fitter network baseline, branch performance baseline.

Phase 2 (6–12 months) — Optimise core operations: AI demand forecasting, inventory and supply optimisation, installation scheduling AI, quote conversion improvement, branch playbooks.

Phase 3 (12–24 months) — Scale customer experience: room visualisation and AR/VR, personalised offers, CRM automation and journeys, NPS and retention programmes, data-driven marketing.

Phase 4 (24–36 months) — Platform and profitability: dynamic pricing engine, advanced analytics and branch intelligence, fitter network enhancements, margin expansion initiatives, capital efficiency.

Phase 5 (36+ months) — Category leadership: an integrated flooring platform, open ecosystem partnerships, AI-powered product innovation, sustainable growth at scale, market share acceleration.

Success factors: strong leadership and change management, data quality and governance, fitter network empowerment, disciplined capital allocation and clear accountability on KPIs. Key enablers: an AI and analytics platform, cloud and data architecture, an omnichannel technology stack, branch tools and mobile apps, and people and training. Investment steps: execute alignment and roadmap sign-off, quick wins to fund scale, pilot then measure, learn and scale, performance tracking and KPIs, and sustained execution discipline.

Carpetright’s future can be AI-powered. Smarter lead conversion. Better fitting economics. Stronger category relevance.

The Multiplier Framework

7 compounding levers

Seven AI multipliers, each with a defined mechanism, application set and annual value range — aggregating to £61M – £110M+ of illustrative annual value potential over three to five years on the existing brand and fitter network.

01

Lead Capture & Quoting

Increase volume and quality of leads via multi-channel capture.

  • AI lead scoring and dynamic quote generation
  • Omnichannel enquiry capture across web, store and phone
  • Automated follow-up across the multi-week decision window

Outcome · £10M – £18M per year

02

Personalised Room Visualisation

Higher conversion via visual in-home confidence on an irreversible purchase.

  • AI room visualisation and style recommendation
  • AR/VR in-home preview experiences
  • Guided selection across fibre, wear rating and room use

Outcome · £8M – £15M per year

03

Pricing Optimisation

Optimise pricing by product, store and channel.

  • AI price elasticity modelling
  • Competitor monitoring and response
  • Dynamic pricing across the estate

Outcome · £8M – £14M per year

04

Installation Scheduling

Maximise fitter utilisation and on-time installs.

  • AI route planning and capacity optimisation
  • Real-time schedule adjustments
  • Completion tracking and quality assurance

Outcome · £10M – £18M per year

05

Inventory & Stocking

Reduce stockouts and overstocks; improve turns.

  • Demand forecasting by store and category
  • Inventory optimisation across bulky slow-moving lines
  • Supplier synchronisation and replenishment

Outcome · £12M – £20M per year

06

Customer & CRM

Increase loyalty, repeat business and referrals.

  • AI segmentation and next-best-action
  • Loyalty and lifecycle engagement
  • Referral programmes across the fitter network

Outcome · £8M – £15M per year

07

Data & Business Intelligence

Smarter decisions across all regional levels.

  • AI dashboards and branch profitability analytics
  • Anomaly detection on sales, stock and service
  • Executive decision reporting

Outcome · £5M – £10M per year

Carpetright: The Value Wasn’t Lost. It Was Mispriced. full strategic breakdown
Mispriced Assets™ · UK & Global Retail Lost Giants — Carpetright: the full six-page institutional report covering the cover and at-a-glance estate, executive summary and financial impact snapshot, UK flooring market framing and competitive landscape, the seven AI multipliers, the five-year financial impact model and the five-phase AI transformation roadmap.

The Verdict

Thirty-five years of heritage, ~90% national recognition, ~270 stores and 1,000+ independent fitters — written down as a failed high-street retailer while the £3BN+ flooring category kept growing at mid single digits. What failed was the model, not the market. Seven multipliers worth £61M – £110M+ a year take revenue from £620M to £980M, EBITDA from negative to £113M and enterprise value from £120M – £180M to £350M – £600M+. Smarter lead conversion. Better fitting economics. Stronger category relevance.

JM founder signature
68 · PureGym — Fitness At Scale. More Personal. More Inclusive.67 · SIXT — Smarter Mobility. Greater Availability. A More Connected Tomorrow.66 · Sendwave — Money That Moves With Intelligence.65 · McDonald’s — Serving The Future With AI.64 · Compare the Market — Smarter Comparison. Better Matches. Brighter Tomorrows.63 · WeBuyAnyCar — Smarter Pricing. Faster Offers. Better Conversion.62 · Primark — Affordable Fashion. Greater Possibilities With AI.61 · Starbucks — Smarter Stores. Stronger Loyalty. Better Margins.60 · IKEA — AI-Powered Home Retail at Global Scale59 · H&M — Smarter Fashion. Brighter Tomorrow.58 · WeWork — The Value Wasn't Lost. It Was Mispriced.57 · Yahoo — The Value Wasn't Lost. It Was Mispriced.56 · Nando's UK — Smarter Restaurants. Stronger Loyalty. Better Margins.55 · The Amplifier54 · The Body Shop53 · Arcadia Group52 · Cazoo51 · Blockbuster48 · Mothercare47 · Phones 4u46 · Farfetch45 · Jumia44 · Toys ‘R’ Us43 · The Collateral Gap — Part One41 · The Amplifier40 · Africa Bee Farming39 · Kenya Airways38 · Africa Greenhouse Farming37 · Uganda Tourism Board36 · Boots UK35 · Biffa (UK)34 · NatWest33 · Skip Hire Companies UK33 · The Audit32 · The Lean Company31 · Africa Mushroom Farming29 · The Rider Economy Nobody Verified28 · The Layer Underneath the Layer27 · Independent Timber Yards & Jewson Timber26 · Link Up TV & GRM Daily25 · East African Portland Cement42 · International Student Credential & Financial Verification — Part One24 · The Supply Chain Inside the Supply Chain23 · The White Space, Mapped22 · The Real Opportunity21 · Greencore20 · West Ham United19 · Roofings Group Uganda18 · Mombasa Port17 · Auto Trader UK16 · Uganda Coffee Development Authority15 · Brookside Dairy14 · GraceKennedy13 · Rightmove12 · Manchester United11 · Greggs30 · Twiga Foods10 · Uchumi09 · Konga08 · Edcon09 · GAME07 · Debenhams06 · Claire's05 · Boohoo04 · Argos