Nando's UK — Smarter Restaurants. Stronger Loyalty. Better Margins. research poster
All Research

The Hidden AI Operating System Audit Series™

Where AI creates new profit pools—not just productivity.

56AI Opportunity Audit™ 17 min readSeptember 2026
Coverage · United Kingdom · Institutional CoverageSector · Restaurants, Hospitality & Consumer LoyaltyFormat · Six-page audit

Nando's UK — Smarter Restaurants. Stronger Loyalty. Better Margins.One of Britain's most distinctive restaurant brands, audited as an operating system.

An AI opportunity audit across Nando's UK restaurant operations, personalisation and growth. FY2025 group revenue of £1.476bn and 25,473 employees sit on top of a high-frequency, digitally-ordered, delivery-heavy demand base — the exact conditions where forecasting, labour scheduling, kitchen orchestration and first-party rewards data compound. The audit sizes £120M–£220M+ of annual AI-driven value by 2030 across revenue uplift, cost and productivity, waste and supply chain, and customer lifetime value — without diluting the brand.

Group Revenue (FY2025)

£1.476BN

Employees (FY2025)

25,473

Annual AI Value by 2030

£120M – £220M+

Revenue Uplift Range

£45M – £80M

Cost & Productivity

£35M – £60M

Waste & Supply Chain

£15M – £30M

Customer Lifetime Value

£25M – £50M

Value Multipliers

7

The Thesis

Nando's is not a restaurant chain with a technology problem; it is a data-rich consumer network that has never been run as one. Founded in 1987 in South Africa and trading in the UK since 1992, it has built one of the country's most distinctive restaurant brands on PERi-PERi, experience and community — and, quietly, on app ordering, rewards, delivery and collect. That combination produces the three inputs an AI operating system needs: high-frequency transactions, first-party identity, and a physical network whose costs move with labour, food and waste. The opportunity is not to automate the brand away. It is to make every restaurant smarter, every customer journey more relevant and every operating decision faster — turning demand forecasting, shift scheduling, kitchen throughput, personalised rewards, channel economics, supply intelligence and service analytics into a single compounding system worth £120M–£220M+ a year by 2030. Same Nando's soul. A smarter operating system.

Exhibit · Report Cover

56 · AI Opportunity Audit™

Nando's UK — Smarter Restaurants. Stronger Loyalty. Better Margins. report cover
Nando's UK — Smarter Restaurants. Stronger Loyalty. Better Margins.September 2026 · United Kingdom · Institutional Coverage
01

Executive summary — distinctive brand, large physical network, data-rich journeys

Nando's combines strong brand equity, high-frequency restaurant demand, digital ordering, rewards, delivery, supply chain complexity and a distinctive in-restaurant experience. Each of those is an AI surface. Together they are an operating system.

FY2025 group revenue stood at £1.476bn with 25,473 employees, a UK presence since 1992 and a Southern African PERi-PERi sourcing heritage that gives the supply chain both provenance value and concentration risk.

The audit isolates seven value levers: AI demand forecasting, restaurant labour and scheduling, kitchen throughput optimisation, personalised rewards, delivery and order-channel optimisation, supply and waste intelligence, and customer service intelligence.

Illustrative ranges: £45m–£80m revenue uplift, £35m–£60m cost and productivity improvement, £15m–£30m waste and supply chain savings and £25m–£50m customer lifetime value — £120M–£220M+ total annual AI-driven value opportunity by 2030.

AI can improve margin, throughput and loyalty without diluting the brand.
  • Founded 1987 in South Africa; UK presence since 1992
  • FY2025 group revenue £1.476bn · 25,473 employees
  • App, rewards, delivery and collect already generate first-party demand signal
  • Seven levers, one operating system, £120M–£220M+ by 2030
02

Market & digital overview — a growing, digital, high-frequency market

The UK restaurant and QSR market is increasingly digital, with higher customer expectations, greater delivery penetration, labour cost pressure and ongoing food inflation. Convenience, personalisation and brand experience are the differentiators that survive that pressure.

Nando's group revenue trajectory — £0.665bn (2021), £1.066bn (2022), £1.271bn (2023), £1.367bn (2024), £1.476bn (2025) — shows a recovered and compounding base, not a turnaround story. AI is being applied to growth, not rescue.

Six market dynamics define the operating environment: digital ordering, loyalty and memberships, delivery economics, labour productivity, food and waste, and experience and brand.

Competitively, Nando's sits between scale QSR (McDonald's: scale, digital, real estate) and premium experience players (Five Guys, Wingstop UK, Popeyes UK). Its defensible position is PERi-PERi, experience-led, inclusive dining with a national restaurant footprint — and its AI opportunity is end-to-end digitalisation, personalisation and operations rather than pure drive-thru automation.

Nando's is more than just chicken. It's brand, experience, frequency and a growing first-party customer relationship.
  • Group revenue CAGR from £0.665bn (2021) to £1.476bn (2025)
  • Delivery penetration and labour cost are the two fastest-moving cost variables
  • Differentiation runs through personalisation, not price
  • AI opportunity: end-to-end digitalisation, personalisation, operations
03

The demand layer — forecasting, labour and kitchen throughput

Demand forecasting and restaurant planning is the first multiplier because every other operating decision inherits its error. Forecasting by site, event and weather, with store-level demand prediction, delivers more accurate sales and better lead time on ordering and rostering — an estimated £20m–£35m annually.

Labour and shift optimisation matches staffing to traffic rather than to habit: scheduling, skills mix and absence prediction reduce idle time while protecting service at peak, worth an estimated £15m–£25m.

Kitchen throughput and order orchestration — kitchen sequencing, order prioritisation and prep-time prediction — reduces queue times and improves consistency, the single most brand-protective use of AI in the estate, worth an estimated £20m–£35m.

Together these three levers address the operating cost base directly and are the fastest to pilot because they need no change to the customer-facing experience.

Every operating decision inherits the forecast's error. Fix the forecast first.
  • 01 Demand forecasting & restaurant planning · £20m–£35m
  • 02 Labour & shift optimisation · £15m–£25m
  • 03 Kitchen throughput & order orchestration · £20m–£35m
  • No customer-facing change required to begin
04

The customer layer — rewards, channels and service intelligence

Personalised rewards and CRM is the largest single lever at an estimated £20m–£40m. Next-best-offer, churn prediction and rewards optimisation increase visit frequency and basket value against an already-identified customer base — the cheapest growth in the model because the audience is owned, not bought.

Delivery and channel economics (£15m–£30m) optimises aggregator versus direct mix, routing, order batching and channel profitability. Margin on a delivered order is a channel decision as much as a menu decision.

Customer and service intelligence (£10m–£25m) uses sentiment, service recovery and menu analytics to improve NPS and recovery — protecting the experience equity the brand was built on.

Supply, inventory and waste intelligence (£15m–£30m) closes the loop: forecasting, supplier analytics and freshness and waste prediction reduce stockouts and procurement friction across a PERi-PERi supply chain with real provenance constraints.

The cheapest growth available is the customer who already has the app.
  • 04 Personalised rewards & CRM · £20m–£40m
  • 05 Delivery & channel economics · £15m–£30m
  • 06 Supply, inventory & waste intelligence · £15m–£30m
  • 07 Customer & service intelligence · £10m–£25m
05

Financial impact model (illustrative) — a stronger, more efficient Nando's

The illustrative model holds adjusted EBITDA margin at 14.7% in FY2025 and moves it to 15.0% (2026), 16.4% (2027), 17.4% (2028), 18.5% (2029) and 19.7% (2030) — a five-point expansion earned through operations, not pricing.

Adjusted EBITDA rises from £148m to £276m across the period, with free cash flow moving from £83m to £175m and AI investment tapering from £30m a year in the build phase to £20m in steady state.

AI-driven value created compounds — £45m, £90m, £150m, £190m, £220m — producing cumulative cost savings of £130m, revenue uplift of £170m and total value created of £590m by Year 5.

Key assumptions: stable brand demand, phased AI adoption, continued labour and food cost pressure, strong digital and rewards adoption, and disciplined capital allocation. Illustrative JM Business Thoughts model; figures do not show minor rounding and are not company guidance.

A five-point margin expansion earned through operations, not price increases.
  • Adj. EBITDA margin 14.7% (FY2025) → 19.7% (2030)
  • Adj. EBITDA £148m → £276m
  • Free cash flow £83m → £175m
  • Total value created by Year 5: £590m cumulative
06

AI transformation roadmap — five phases, 36+ months

Phase 1, Foundation (0–6 months): data audit and restaurant tech baseline, AI governance and ethical framework, demand forecasting pilots, and digital identity and customer data mapping.

Phase 2, Pilots & Capability (6–12 months): labour scheduling optimisation, restaurant demand models, waste prediction pilots, rewards personalisation and service analytics.

Phase 3, Scale & Integrate (12–24 months): kitchen and order orchestration, supply optimisation, delivery and channel economics, a unified restaurant data platform and a scalable AI platform.

Phase 4, Optimise & Expand (24–36 months): autonomous demand and scheduling, dynamic menu and offer intelligence, advanced forecasting, supplier collaboration and cross-market expansion. Phase 5, Lead & Innovate (36+ months): AI-native operating rhythm, predictive network planning, new digital revenue opportunities, best-in-class customer intelligence and continuous differentiation.

Success factors: leadership buy-in, data quality and integration, change management and measurable ROI with quick wins. Key enablers: modern data and AI platform, a cross-functional team spanning operations, digital and finance, a partner ecosystem and clear governance for responsible AI.
Prioritise two to three pilot use cases, build the data foundation, define success metrics, scale on results.
  • Phase 1 Foundation · 0–6 months
  • Phase 2 Pilots & Capability · 6–12 months
  • Phase 3 Scale & Integrate · 12–24 months
  • Phase 4 Optimise & Expand · 24–36 months · Phase 5 Lead & Innovate · 36+ months
07

Sources and method

Company financials and employee data: Nando's annual report and filings, FY2021–FY2025.

Market structure and competitive landscape: UK restaurant and QSR industry reports; JM Business Thoughts analysis of digital ordering, delivery penetration and loyalty economics.

Value ranges are illustrative and modelled per lever against disclosed revenue and cost structure. They are not company guidance and JM Business Thoughts does not provide company guidance.

Method note: each multiplier is sized independently, then netted for overlap before the total annual value range is stated.

The Multiplier Framework

7 compounding levers

Seven AI multipliers that unlock exponential value — from restaurant operations to lifetime loyalty.

01

Demand Forecasting & Restaurant Planning

More accurate sales and better lead time · £20m–£35m annually.

  • Forecast by site, event and weather with store-level demand prediction
  • Drive ordering, rostering and prep volumes from a single forecast
  • Measure forecast error as a board-level operating metric

Outcome · Every downstream decision inherits a better number instead of a habit.

02

Labour & Shift Optimisation

Match staffing to traffic and reduce idle time · £15m–£25m.

  • Optimise scheduling, skills mix and absence prediction
  • Protect peak service levels while cutting low-traffic hours
  • Give managers a recommended roster, not a blank grid

Outcome · Labour cost falls without the service degradation that usually accompanies it.

03

Kitchen Throughput & Order Orchestration

Reduce queue times and improve consistency · £20m–£35m.

  • Sequence kitchen work and prioritise orders across dine-in, collect and delivery
  • Predict prep time per item and per basket
  • Hold consistency standards across the estate, not just the flagship sites

Outcome · Throughput rises and the experience the brand is known for gets more reliable, not less.

04

Personalised Rewards & CRM

Increase visit frequency and basket value · £20m–£40m.

  • Deploy next-best-offer and churn prediction against the identified base
  • Optimise rewards economics rather than discount depth
  • Tie offers to forecast capacity so demand lands where there is room

Outcome · The largest single lever in the model, powered by an audience the business already owns.

05

Delivery & Channel Economics

Optimise aggregator/direct mix and fulfilment · £15m–£30m.

  • Model channel profitability per order, per site, per daypart
  • Use routing and order batching to lower cost to serve
  • Shift demand to the highest-margin channel with pricing and offers

Outcome · Delivery stops being a volume line and becomes a managed margin line.

06

Supply, Inventory & Waste Intelligence

Reduce waste, stockouts and procurement friction · £15m–£30m.

  • Forecast freshness and waste at item level
  • Apply supplier analytics across the PERi-PERi supply chain
  • Automate reorder points against predicted, not historic, demand

Outcome · Food cost pressure is absorbed by better prediction instead of by menu price.

07

Customer & Service Intelligence

Improve NPS, recovery and menu insight · £10m–£25m.

  • Run sentiment analysis across reviews, app feedback and service contacts
  • Automate service recovery before a complaint escalates
  • Feed menu analytics back into development and pricing

Outcome · Experience equity is measured and defended with the same rigour as cost.

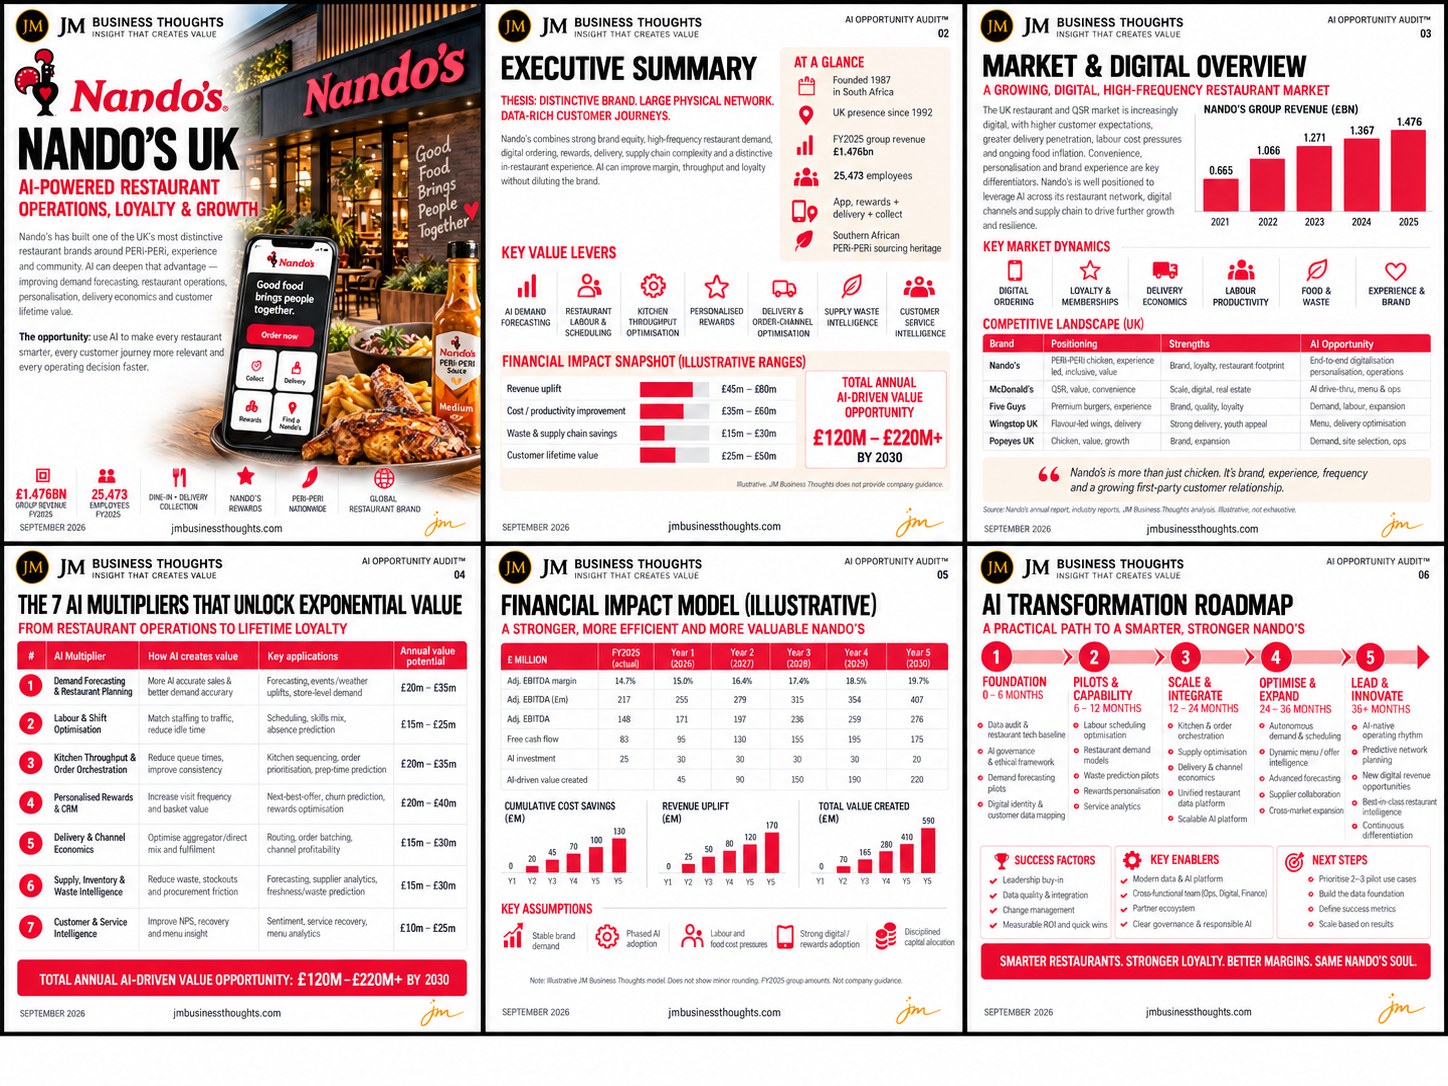
Nando's UK — Smarter Restaurants. Stronger Loyalty. Better Margins. full strategic breakdown
Nando's UK · AI Opportunity Audit™ — full six-page brief: 01 Cover, 02 Executive Summary and Financial Impact Snapshot, 03 Market & Digital Overview with competitive landscape, 04 The 7 AI Multipliers, 05 Financial Impact Model (illustrative), 06 AI Transformation Roadmap.

The Verdict

Nando's does not need reinvention; it needs instrumentation. A £1.476bn revenue base, 25,473 employees and a high-frequency, app-led customer relationship give the business every input an AI operating system requires, and almost none of them are being compounded today. Forecasting, labour, kitchen throughput, rewards, channel economics, supply intelligence and service analytics are each defensible on their own economics and collectively worth £120M–£220M+ annually by 2030, taking adjusted EBITDA margin from 14.7% to 19.7% on an illustrative basis. The risk is not that AI dilutes the brand — it is that a competitor with less brand equity builds the operating system first and competes on speed, price and relevance at once. Smarter restaurants. Stronger loyalty. Better margins. Same Nando's soul.

JM founder signature
68 · PureGym — Fitness At Scale. More Personal. More Inclusive.67 · SIXT — Smarter Mobility. Greater Availability. A More Connected Tomorrow.66 · Sendwave — Money That Moves With Intelligence.65 · McDonald’s — Serving The Future With AI.64 · Compare the Market — Smarter Comparison. Better Matches. Brighter Tomorrows.63 · WeBuyAnyCar — Smarter Pricing. Faster Offers. Better Conversion.62 · Primark — Affordable Fashion. Greater Possibilities With AI.61 · Starbucks — Smarter Stores. Stronger Loyalty. Better Margins.60 · IKEA — AI-Powered Home Retail at Global Scale59 · H&M — Smarter Fashion. Brighter Tomorrow.58 · WeWork — The Value Wasn't Lost. It Was Mispriced.57 · Yahoo — The Value Wasn't Lost. It Was Mispriced.54 · The Body Shop53 · Arcadia Group52 · Cazoo51 · Blockbuster50 · Carpetright49 · Wilko48 · Mothercare47 · Phones 4u46 · Farfetch45 · Jumia44 · Toys ‘R’ Us43 · The Collateral Gap — Part One41 · The Amplifier40 · Africa Bee Farming39 · Kenya Airways38 · Africa Greenhouse Farming37 · Uganda Tourism Board36 · Boots UK35 · Biffa (UK)34 · NatWest33 · Skip Hire Companies UK33 · The Audit32 · The Lean Company31 · Africa Mushroom Farming29 · The Rider Economy Nobody Verified28 · The Layer Underneath the Layer27 · Independent Timber Yards & Jewson Timber26 · Link Up TV & GRM Daily25 · East African Portland Cement42 · International Student Credential & Financial Verification — Part One24 · The Supply Chain Inside the Supply Chain23 · The White Space, Mapped22 · The Real Opportunity21 · Greencore20 · West Ham United19 · Roofings Group Uganda18 · Mombasa Port17 · Auto Trader UK16 · Uganda Coffee Development Authority15 · Brookside Dairy14 · GraceKennedy13 · Rightmove12 · Manchester United11 · Greggs30 · Twiga Foods10 · Uchumi09 · Konga08 · Edcon09 · GAME07 · Debenhams06 · Claire's05 · Boohoo04 · Argos