Farfetch: The Value Wasn’t Lost. It Was Mispriced. research poster
All Research
46Mispriced Assets™ 22 min readAugust 2026
Coverage · United Kingdom · 190+ Countries · Institutional CoverageSector · Global Luxury · Digital Commerce, Marketplace & Brand TechnologyFormat · Six-page audit

FarfetchA Case Study In Strategic Value Overlooked, Not Destroyed.

Farfetch reached 190+ countries, 10M+ active customers, 35,500+ boutiques and brands and 1.4M+ live products before its equity was written down to near zero. Global luxury demand did not fall — it moved online. What failed was capital discipline, cost-to-serve and the pricing of a technology and distribution estate that nobody else in luxury owns. This audit separates what was destroyed from what was written off at the wrong number, and sizes £120M – £200M+ of annual AI-driven value on the same footprint.

Countries Served

190+

Active Customers

10M+

Boutiques & Brands

35,500+

Products Live

1.4M+

App Downloads

10M+

Global Luxury Market (2024)

~£370B

Online Luxury By 2030

~30% Of Total

Annual AI Value Potential

£120M – £200M+

The Thesis

Farfetch built the only genuinely global luxury distribution rail: 35,500+ boutiques and brands, 1.4M+ live products, 10M+ customers and delivery into 190+ countries, plus the technology stack that luxury houses themselves rent to sell direct. The market repriced that estate as a failed retailer. It is not a retailer — it is a marketplace, a logistics network and an enterprise software business sold under one ticker at the multiple of the weakest of the three. Every variable that decides whether the platform compounds — conversion per session, contribution per parcel, return rate per SKU, retention per cohort, loss per fraudulent order — is a prediction problem sitting on the deepest first-party luxury dataset in existence. Our analysis sizes £120M – £200M+ of annual AI-driven value by 2030 on a £2.18BN revenue and £3.4BN GMV base, with adjusted EBITDA margin moving from –1.8% toward 6–10%+ and free cash flow from £24M to £120M – £250M+ — without adding a single new market.

Exhibit · Report Cover

46 · Mispriced Assets™

Farfetch: The Value Wasn’t Lost. It Was Mispriced. report cover
Farfetch: The Value Wasn’t Lost. It Was Mispriced.August 2026 · United Kingdom · 190+ Countries · Institutional Coverage
01

Executive summary: three businesses priced as one distressed retailer

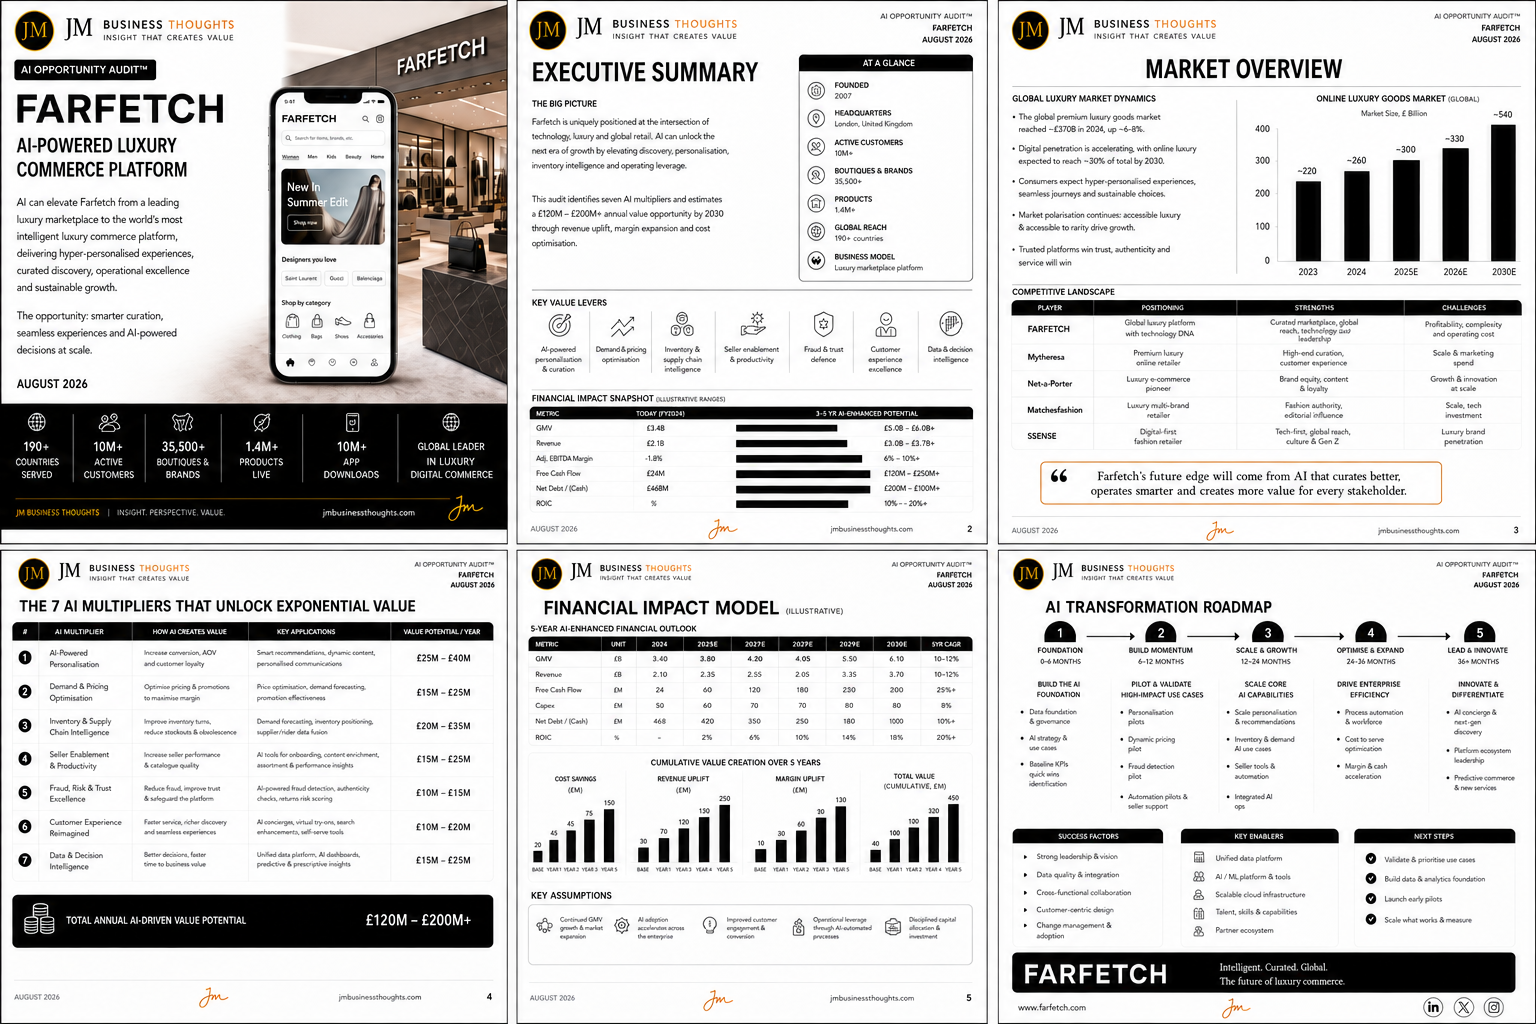
Farfetch is uniquely positioned at the intersection of technology, luxury and global retail. AI can elevate the next era of growth by lifting personalisation, inventory intelligence and operating leverage on an estate that already exists and is already paid for.

The at-a-glance position is unusual for a company whose equity was written to near zero: 190+ countries served, 10M+ active customers, 35,500+ boutiques and brands, 1.4M+ products live, 10M+ app downloads and a defensible position as the global leader in luxury digital commerce.

This audit identifies seven AI multipliers and estimates £120M – £200M+ of annual value potential by 2030 through revenue uplift, margin expansion and cost optimisation. The mispricing is structural, not sentimental: a marketplace, a last-mile luxury logistics network and an enterprise commerce platform were valued as one loss-making shop.

The financial snapshot frames the gap precisely. Today (FY2024): GMV £3.4BN, revenue £2.18BN, adjusted EBITDA margin –1.8%, free cash flow £24M, net debt £468M. On a three-to-five year AI-enhanced path: GMV £5.0BN – £6.0BN+, revenue £3.0BN – £3.78BN+, EBITDA margin 6–10%+, free cash flow £120M – £250M+, net debt reduced to £200M – £100M, ROIC 10% – 20%+.

£120M – £200M+ per year by 2030 — on a £2.18BN revenue and £3.4BN GMV base already in place.
  • GMV: £3.4B today → £5.0B – £6.0B+ potential
  • Revenue: £2.18B today → £3.0B – £3.78B+ potential
  • Adjusted EBITDA margin: –1.8% today → 6–10%+ potential
  • Free cash flow: £24M today → £120M – £250M+ potential
  • Net debt: £468M today → £200M – £100M potential
  • ROIC: negative today → 10–20%+ potential
02

Market overview: ~£370BN luxury, ~30% online by 2030

The global premium luxury goods market reached roughly £370BN in 2024, up around 6–8%. The category did not soften structurally — it concentrated, and it moved channel.

Digital penetration is accelerating, with online luxury expected to reach around 30% of total by 2030. The online luxury goods market is modelled at approximately £220BN (2023), £260BN (2024), £300BN (2025E), £330BN (2026E) and £540BN (2030E). That is the single most important number in this audit: the channel Farfetch built for is the channel that grows.

Consumers expect hyper-personalised experiences, seamless journeys and sustainable choices. Market polarisation continues: accessible luxury and access to rarity both drive growth, while the undifferentiated middle compresses. Trusted platforms with authenticity, curation and service will win — and each of those three is now a model problem, not a merchandising instinct.

The competitive landscape sharpens the case. Farfetch is the global luxury platform with technology DNA: curated discovery, global reach, technology and leadership — offset by profitability, complexity and operating cost. Mytheresa competes as a premium luxury online retailer with high-end curation and customer experience, constrained by scale and marketing spend. Net-a-Porter carries brand equity, editorial and content strengths against growth and innovation at scale. Matchesfashion held fashion authority and editorial influence but lacked scale and technology investment. SSENSE leads on tech-first, digital-native reach and Gen Z culture with limited luxury-brand penetration.

Online luxury: ~£260BN in 2024 → ~£540BN by 2030. The channel Farfetch built for is the channel that compounds.
  • Global premium luxury market (2024): ~£370B, +6–8%
  • Online luxury goods market: ~£220B (2023) → ~£540B (2030E)
  • Digital penetration reaching ~30% of total luxury by 2030
  • Competitive set: Mytheresa, Net-a-Porter, Matchesfashion, SSENSE
  • Winners defined by authenticity, curation and service — all model-driven
03

The mispricing: what was destroyed versus what was written off

Distressed processes clear assets at the speed the seller needs, not the value the asset holds. Farfetch is the clearest recent example in global luxury.

The marketplace network — 35,500+ boutiques and brands across 190+ countries — is a supply asset that cannot be rebuilt with capital alone. It took fifteen years of relationship-by-relationship onboarding in a category where brands control distribution obsessively. It was repriced as inventory risk.

The customer estate — 10M+ active customers and 10M+ app downloads, with high-value purchase history at the top of the global income distribution — is the most valuable behavioural dataset in luxury. It was repriced as marketing spend already sunk.

The technology platform — the enterprise stack luxury houses used to run their own direct channels — is a software business with recurring characteristics and brand-side switching costs. It was repriced inside a retail multiple.

The logistics and authentication rail — cross-border luxury fulfilment, duties, returns and provenance across 190+ countries — is the operating moat that determines whether luxury e-commerce works at all. It was repriced as cost-to-serve.

None of those four assets was destroyed. What was destroyed was equity value in a capital structure that funded growth ahead of contribution. That is a financing failure. Financing failures are recoverable; demand failures are not.

Four assets nobody else in luxury owns, repriced as one loss-making retailer.
  • Supply network: 35,500+ boutiques and brands — fifteen years to assemble, unbuyable at speed
  • Customer estate: 10M+ active customers, 10M+ app downloads, high-value purchase history
  • Technology platform: enterprise luxury commerce stack with brand-side switching costs
  • Logistics and authentication: cross-border luxury fulfilment across 190+ countries
  • What actually failed: capital structure and cost-to-serve, not category demand
04

Where the money actually leaks

Four leaks dominate a global luxury marketplace, and none of them appear in a headline take-rate.

The first is relevance. 1.4M+ live products against a mobile-first session means the first eight results are the store. Luxury discovery is a curation problem with a very long tail and very low tolerance for irrelevance; a few points of basket-relevant impressions moves GMV further than any available marketing budget.

The second is returns and markdown. In luxury e-commerce, return rates and end-of-season markdown decide contribution margin more than gross take-rate does. Fit, expectation-setting, imagery quality and demand-accurate buying are all predictable, and every avoided return is close to pure margin.

The third is cost-to-serve per parcel. Cross-border duties, split shipments from thousands of independent boutiques, failed deliveries and expedited freight compound. Fulfilment intelligence — which node ships which item, batched, at which service level — is where the £20M – £35M inventory and supply chain multiplier lives.

The fourth is trust integrity: fraud, chargebacks, counterfeit exposure and account takeover across high-ticket baskets. A single fraudulent £5,000 order costs more than a hundred marketing clicks. Detection quality is worth £10M – £15M a year before any second-order retention effect.

  • Relevance gap: 1.4M+ SKUs ranked into mobile-first sessions with generic discovery
  • Returns and markdown gap: the true determinant of luxury contribution margin
  • Cost-to-serve gap: split cross-border shipments from 35,500+ independent sellers
  • Integrity gap: fraud, chargeback and counterfeit exposure on high-ticket baskets
05

Financial impact potential: the value lever stack

The seven levers are sized independently against the current base and aggregate to the headline range.

On the revenue side, AI-powered personalisation contributes £25M – £40M through conversion, AOV and loyalty; customer experience reimagined contributes £10M – £20M through faster service, richer discovery and search; and seller enablement and productivity contributes £15M – £25M through seller performance and catalogue quality.

On the margin side, demand and pricing optimisation contributes £15M – £25M through price optimisation, demand forecasting and promotion effectiveness, while inventory and supply chain intelligence contributes £20M – £35M through inventory turns and reduced stockouts and obsolescence.

Fraud, risk and trust excellence contributes £10M – £15M, and data and decision intelligence contributes £15M – £25M through unified platforms, dashboards and predictive and prescriptive insight. Total annual AI-driven value potential: £120M – £200M+.

Total annual AI-driven value potential: £120M – £200M+.
  • AI-powered personalisation: £25M – £40M
  • Demand & pricing optimisation: £15M – £25M
  • Inventory & supply chain intelligence: £20M – £35M
  • Seller enablement & productivity: £15M – £25M
  • Fraud, risk & trust excellence: £10M – £15M
  • Customer experience reimagined: £10M – £20M
  • Data & decision intelligence: £15M – £25M
06

The five-year financial impact model

The illustrative model runs a full AI-enhanced transformation over five years from an FY2024 base. GMV moves £3.40BN → £3.80BN → £4.20BN → £4.05BN → £5.50BN → £6.10BN, a 10–12% CAGR. Revenue moves £2.10BN → £2.35BN → £2.55BN → £3.05BN → £3.35BN → £3.70BN on the same 10–12% band.

The cash story is the real story. Free cash flow moves £24M → £60M → £120M → £180M → £230M → £200M at a 25%+ CAGR, while capex holds broadly flat at £50M → £60M → £70M → £70M → £80M → £80M — an 8% CAGR. Value is coming from intelligence applied to installed capacity, not from new capital intensity.

That converts the balance sheet. Net debt moves £468M → £420M → £350M → £250M → £180M → £100M, a 10%+ reduction CAGR, while ROIC moves from negative to 2% → 6% → 10% → 14% → 18%, a 20%+ trajectory.

Cumulative value creation over five years splits into cost savings of £20M → £45M → £75M → £120M → £150M, revenue uplift of £30M → £70M → £120M → £180M → £250M, and margin uplift of £10M → £30M → £60M → £90M → £130M — aggregating to a cumulative total of £40M → £100M → £190M → £320M → £450M.

Free cash flow £24M → £200M+. Net debt £468M → £100M. ROIC negative → 18%.
  • GMV (£B): 3.40 → 3.80 → 4.20 → 4.05 → 5.50 → 6.10 (10–12% CAGR)
  • Revenue (£B): 2.10 → 2.35 → 2.55 → 3.05 → 3.35 → 3.70 (10–12% CAGR)
  • Free cash flow (£M): 24 → 60 → 120 → 180 → 230 → 200 (25%+ CAGR)
  • Capex (£M): 50 → 60 → 70 → 70 → 80 → 80 (8% CAGR)
  • Net debt (£M): 468 → 420 → 350 → 250 → 180 → 100
  • ROIC: — → 2% → 6% → 10% → 14% → 18%
  • Cumulative value (£M): 40 → 100 → 190 → 320 → 450
07

Key assumptions and execution risk

The model assumes continued GMV growth and market expansion, AI adoption accelerating across the enterprise, improved customer engagement and conversion, operational leverage through AI-automated processes, and disciplined capital allocation and investment.

The binding constraints are not model quality. They are data unification across marketplace, brand-platform and logistics stacks; brand-partner consent over how first-party luxury data is used; and the change management required to make buyers, boutiques and brand teams act on model output rather than override it on instinct.

Luxury adds a specific risk that mass-market e-commerce does not: brand equity is the product. Personalisation that reads as discounting, or automation that reads as generic, destroys the exact scarcity the category monetises. Every use case has to be built to protect desirability first and conversion second — which is a design constraint, not a reason to delay.

Key enablers are a unified data platform, AI and ML platforms and tooling, scalable cloud infrastructure, talent, skills and capabilities, and a partner ecosystem across brands, boutiques and logistics.

  • Continued GMV growth and market expansion
  • AI adoption accelerating across the enterprise
  • Improved customer engagement and conversion
  • Operational leverage through AI-automated processes
  • Disciplined capital allocation and investment
  • Enablers: unified data platform, AI/ML tooling, cloud, talent, partner ecosystem
08

AI transformation roadmap: five phases

Phase 1 (0–6 months) — Foundation: build the AI foundation with data foundation and governance, AI strategy and use cases, and baseline KPIs and quick-wins identification.

Phase 2 (6–12 months) — Build momentum: pilot and validate high-impact use cases — personalisation pilots, a dynamic pricing pilot, a fraud detection pilot, and automation pilots plus seller support.

Phase 3 (12–24 months) — Scale and growth: scale core AI capabilities including personalisation and recommendations, inventory and demand AI use cases, seller tools and automation, and integrated AI operations.

Phase 4 (24–36 months) — Optimise and expand: drive enterprise efficiency through process automation and workforce enablement, cost-to-serve optimisation, and margin and cash acceleration.

Phase 5 (36+ months) — Lead and innovate: innovate and differentiate with an AI concierge and next-gen discovery, platform ecosystem leadership, and predictive commerce and new services.

Success factors are cultural before technical: strong leadership and vision, data quality and integration, cross-functional collaboration, customer-centric design, and change management and adoption. Next steps: validate and prioritise use cases, build the data and analytics foundation, launch early pilots, and scale what works while measuring it.

Intelligent. Curated. Global. The future of luxury commerce.

The Multiplier Framework

7 compounding levers

Seven AI multipliers, each with a defined mechanism, application set and annual value range — aggregating to £120M – £200M+ of AI-driven value per year, delivered on the estate that already exists.

01

AI-Powered Personalisation

Increase conversion, AOV and customer loyalty across 10M+ active customers.

  • Smart recommendations and dynamic content
  • Personalised communications and lifecycle journeys
  • Curated discovery that protects desirability, not just click-through

Outcome · £25M – £40M per year

02

Demand & Pricing Optimisation

Optimise pricing and promotions to maximise margin across 1.4M+ live products.

  • Price optimisation by market, brand and season
  • Demand forecasting across a long-tail luxury catalogue
  • Promotion effectiveness and markdown control

Outcome · £15M – £25M per year

03

Inventory & Supply Chain Intelligence

Improve inventory turns and reduce stockouts and obsolescence.

  • Demand forecasting and inventory positioning
  • Supplier and rider data fusion across fulfilment nodes
  • Cross-border routing, batching and duty intelligence

Outcome · £20M – £35M per year

04

Seller Enablement & Productivity

Increase seller performance and catalogue quality across 35,500+ boutiques and brands.

  • AI tools for onboarding and content enrichment
  • Assortment and performance insights
  • Automated quality, imagery and dispatch scoring

Outcome · £15M – £25M per year

05

Fraud, Risk & Trust Excellence

Reduce fraud, improve trust and safeguard the platform on high-ticket baskets.

  • AI-powered fraud detection and authenticity checks
  • Returns-abuse and chargeback risk scoring
  • Account and brand protection

Outcome · £10M – £15M per year

06

Customer Experience Reimagined

Faster service, richer discovery and seamless experiences across 10M+ app downloads.

  • AI concierge, virtual try-ons and visual search
  • Search enhancement and self-serve tools
  • Automated returns and service resolution

Outcome · £10M – £20M per year

07

Data & Decision Intelligence

Better decisions, faster time to business value across brand, buy and market.

  • Unified data platform and AI dashboards
  • Predictive and prescriptive insight for buying and pricing
  • First-party luxury data activation with brand-level governance

Outcome · £15M – £25M per year

Farfetch: The Value Wasn’t Lost. It Was Mispriced. full strategic breakdown
Mispriced Assets™ · Global Luxury & Digital Commerce — Farfetch: the full six-page institutional report covering the cover and at-a-glance estate, executive summary and financial impact snapshot, global luxury market overview and competitive landscape, the seven AI multipliers, the five-year AI-enhanced financial model with cumulative value creation, and the five-phase AI transformation roadmap.

The Verdict

190+ countries, 10M+ customers, 35,500+ boutiques and brands, 1.4M+ live products and the technology stack luxury houses used to sell direct — assembled over fifteen years and then repriced as a loss-making shop. The category grew: online luxury moves from ~£260BN to ~£540BN by 2030. Seven multipliers convert the same footprint into £120M – £200M+ of annual value, free cash flow from £24M to £200M+, net debt from £468M to £100M and ROIC from negative to 18% — without one new market. The value wasn’t lost. It was mispriced.

JM founder signature
68 · PureGym — Fitness At Scale. More Personal. More Inclusive.67 · SIXT — Smarter Mobility. Greater Availability. A More Connected Tomorrow.66 · Sendwave — Money That Moves With Intelligence.65 · McDonald’s — Serving The Future With AI.64 · Compare the Market — Smarter Comparison. Better Matches. Brighter Tomorrows.63 · WeBuyAnyCar — Smarter Pricing. Faster Offers. Better Conversion.62 · Primark — Affordable Fashion. Greater Possibilities With AI.61 · Starbucks — Smarter Stores. Stronger Loyalty. Better Margins.60 · IKEA — AI-Powered Home Retail at Global Scale59 · H&M — Smarter Fashion. Brighter Tomorrow.58 · WeWork — The Value Wasn't Lost. It Was Mispriced.57 · Yahoo — The Value Wasn't Lost. It Was Mispriced.56 · Nando's UK — Smarter Restaurants. Stronger Loyalty. Better Margins.55 · The Amplifier54 · The Body Shop53 · Arcadia Group52 · Cazoo51 · Blockbuster50 · Carpetright49 · Wilko48 · Mothercare47 · Phones 4u44 · Toys ‘R’ Us43 · The Collateral Gap — Part One41 · The Amplifier40 · Africa Bee Farming39 · Kenya Airways38 · Africa Greenhouse Farming37 · Uganda Tourism Board36 · Boots UK35 · Biffa (UK)34 · NatWest33 · Skip Hire Companies UK33 · The Audit32 · The Lean Company31 · Africa Mushroom Farming29 · The Rider Economy Nobody Verified28 · The Layer Underneath the Layer27 · Independent Timber Yards & Jewson Timber26 · Link Up TV & GRM Daily25 · East African Portland Cement42 · International Student Credential & Financial Verification — Part One24 · The Supply Chain Inside the Supply Chain23 · The White Space, Mapped22 · The Real Opportunity21 · Greencore20 · West Ham United19 · Roofings Group Uganda18 · Mombasa Port17 · Auto Trader UK16 · Uganda Coffee Development Authority15 · Brookside Dairy14 · GraceKennedy13 · Rightmove12 · Manchester United11 · Greggs30 · Twiga Foods10 · Uchumi09 · Konga08 · Edcon09 · GAME07 · Debenhams06 · Claire's05 · Boohoo04 · Argos